Under the Manpower section the features listed below are available to the user-
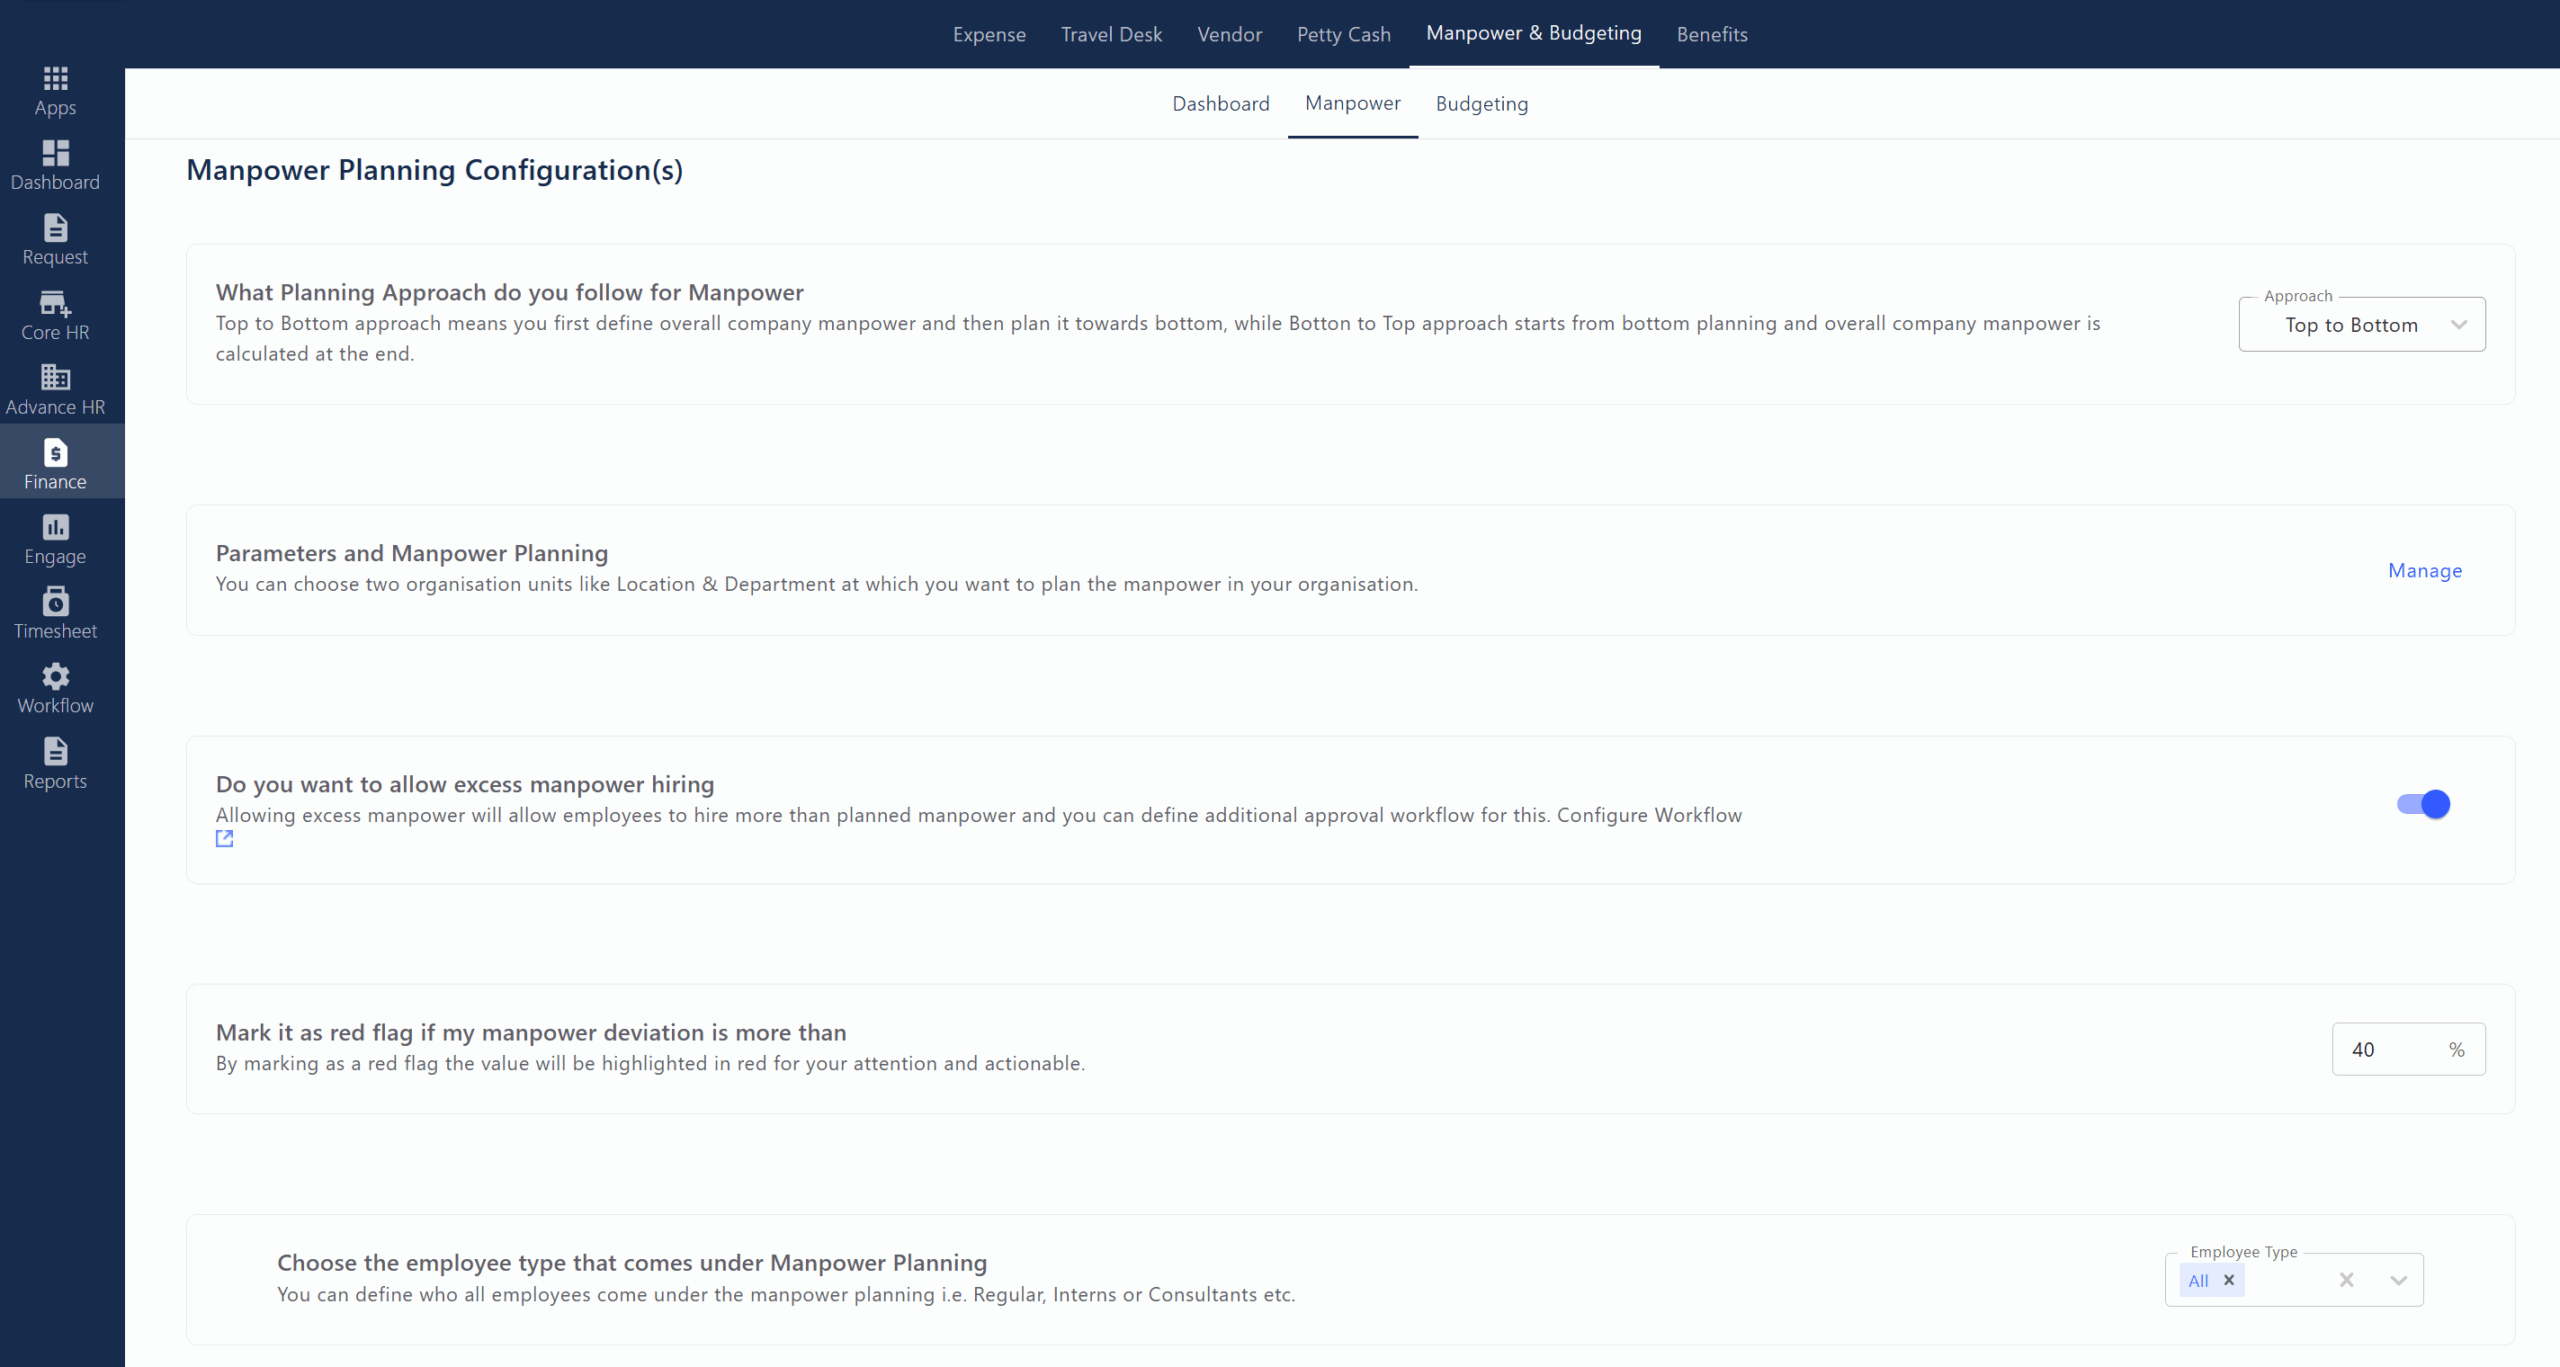
- What Planning Approach do you follow for Manpower:
Select between “Top to Bottom” or “Bottom to Top” approach for manpower planning in the organization. - Parameters and Manpower Planning:
Choose organizational units (like Location and Department) for which you want to plan manpower.

Manpower Planning Parameters List
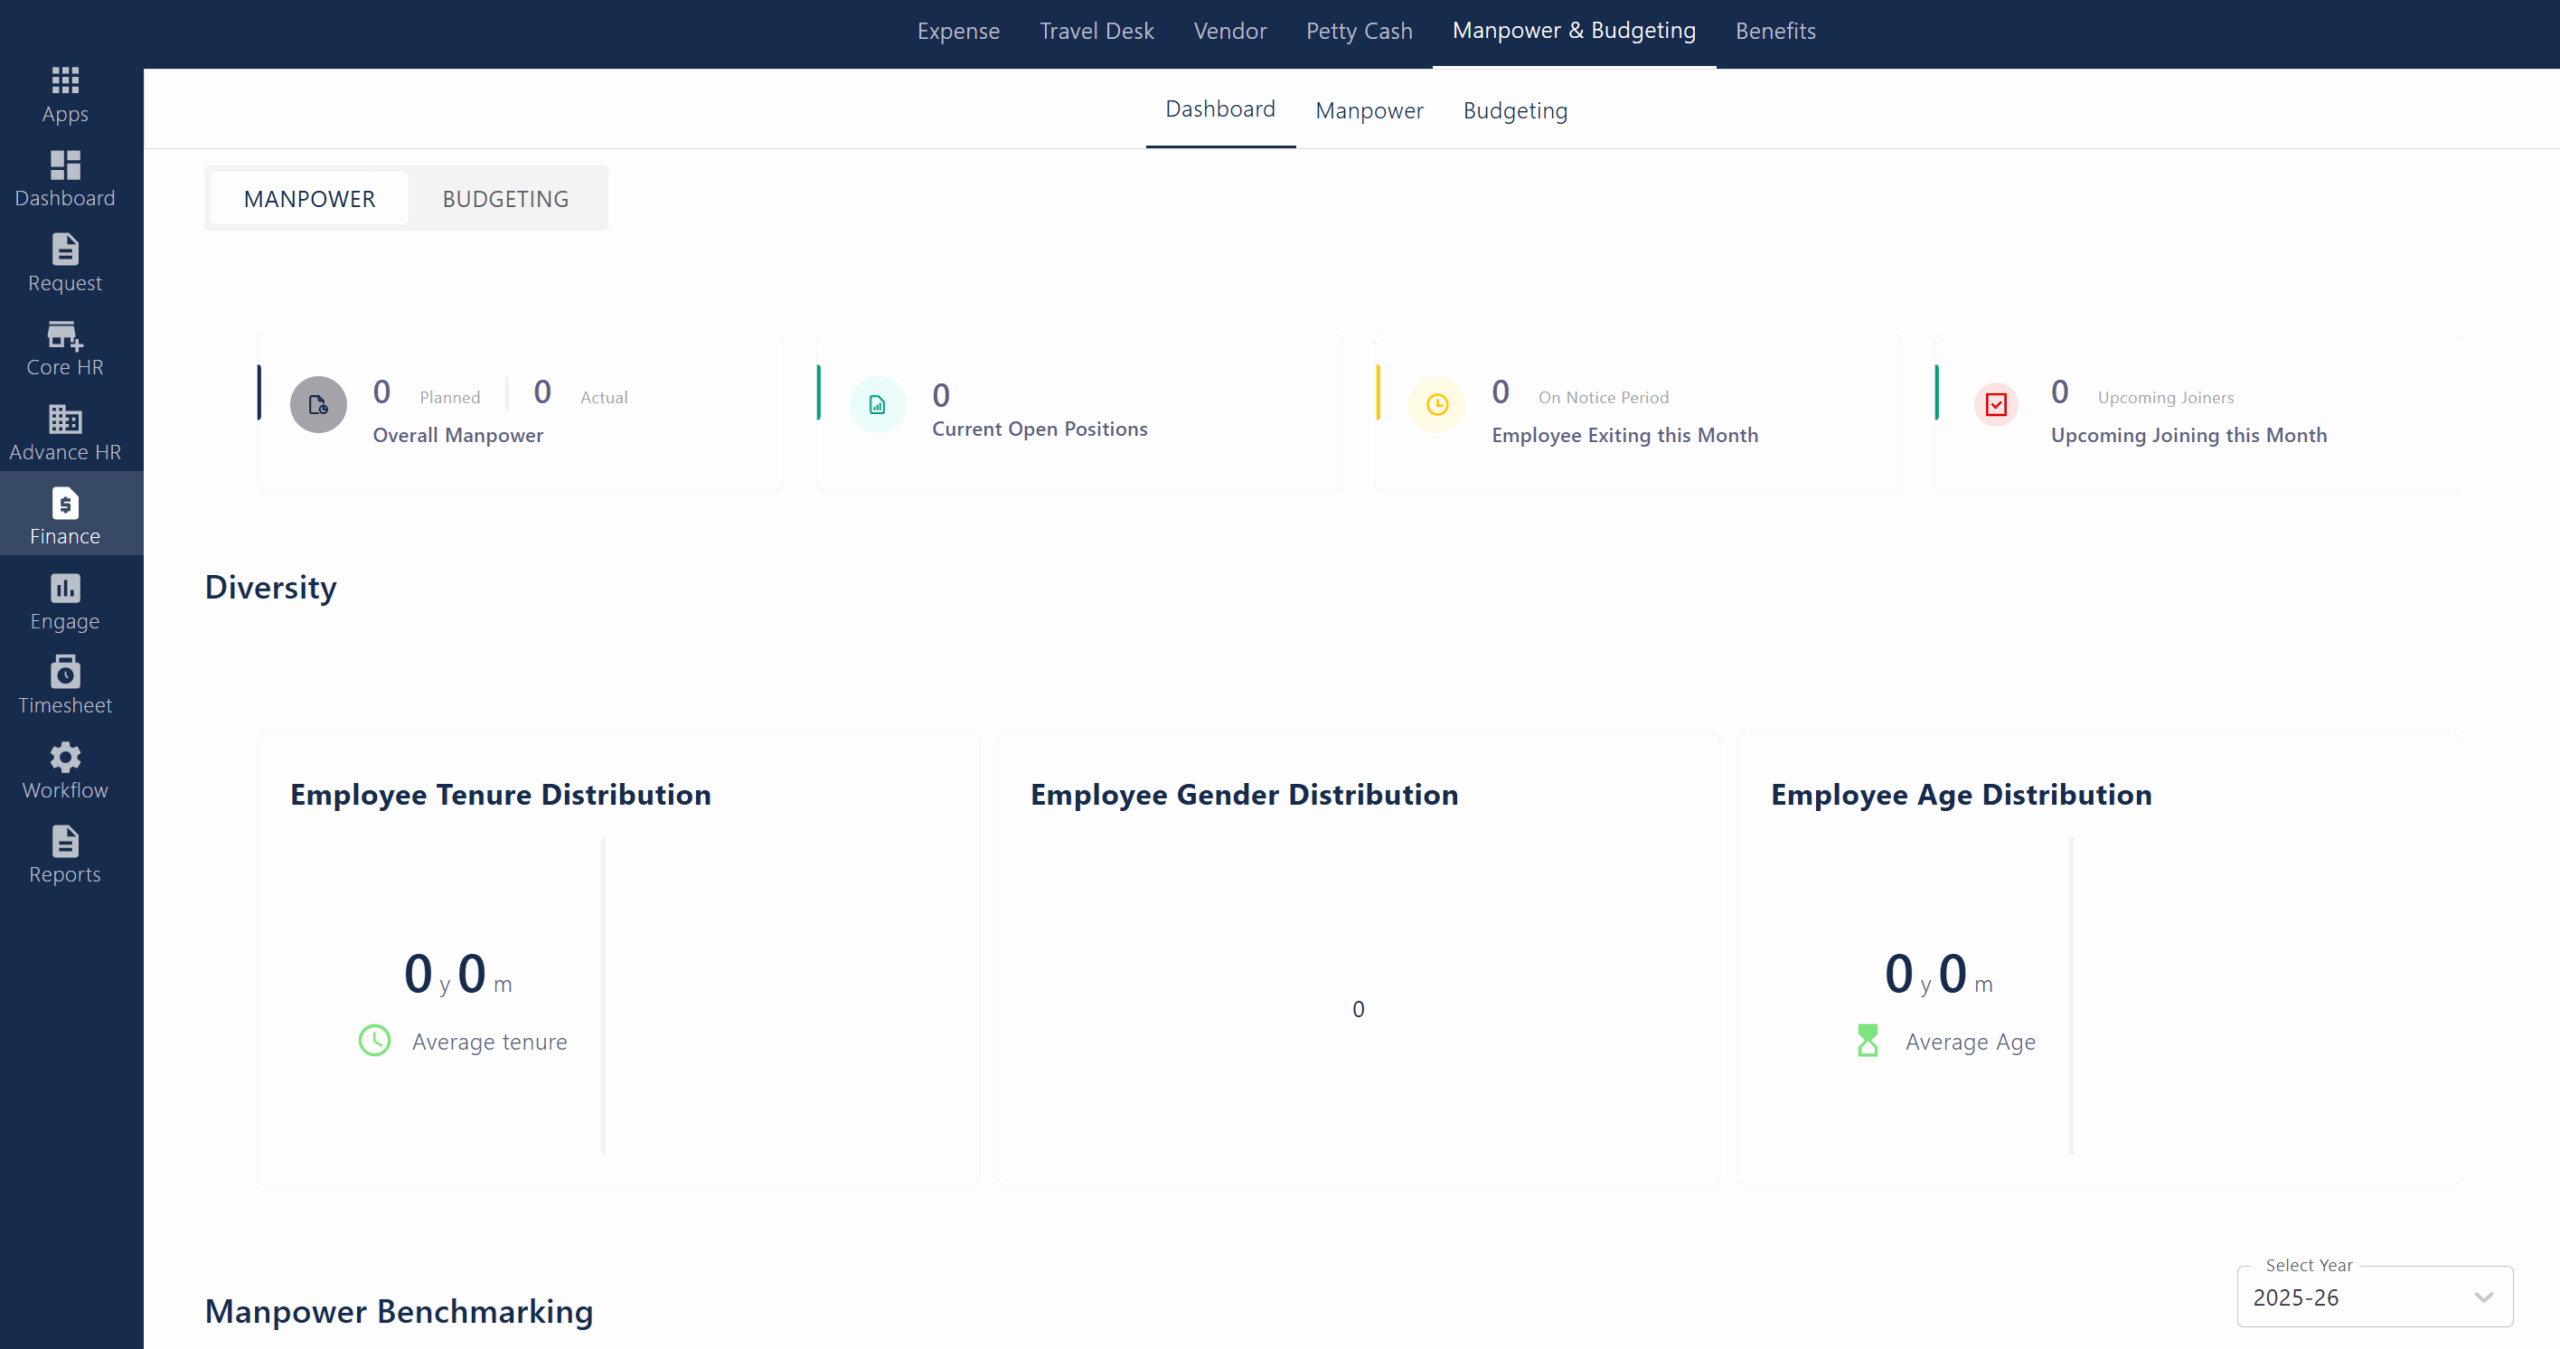
- Planning Year:
Shows the year for which manpower planning is being done. - Total Manpower Planned:
Displays the number of employees planned for that year. - Actual Manpower:
Shows the current number of employees for that year. - Parameters:
Indicates the organizational units (like Department, Location, Entity) used for planning. - Actions (Manage):
Link to view or edit the detailed manpower plan for each year. - Add New Plan:
Button to create a new manpower planning cycle.
Detailed Manpower Planning Matrix
- Filters (Planning Year, Primary/Secondary Parameter, Plan Type):
Allows selection of year, main and secondary planning parameters (e.g., department, location), and plan type (e.g., yearly). - Total Manpower:
Displays the total number of planned employees for the selected year. - Matrix/Table View:
Shows planned vs. actual manpower for each department and location, with deviations highlighted (e.g., in red for red flags). - Deviation Indicators:
Numbers and arrows indicate whether actual manpower is above or below the plan, with color coding for significant deviations. - Bulk Upload:
Button to upload manpower data in bulk via Excel. - Export to Excel:
Button to download the data as an Excel file. - Note Section:
Explains how deviations are calculated and what the color codes mean.
- Planning Year:
- Do you want to allow excess manpower hiring:
Enable or disable the option to hire more than the planned manpower, with additional approval workflow if enabled. - Mark it as red flag if my manpower deviation is more than:
Set a percentage threshold; deviations beyond this will be highlighted as a red flag for attention. - Choose the employee type that comes under Manpower Planning:
Define which employee types (e.g., Regular, Interns, Consultants) are included in manpower planning.
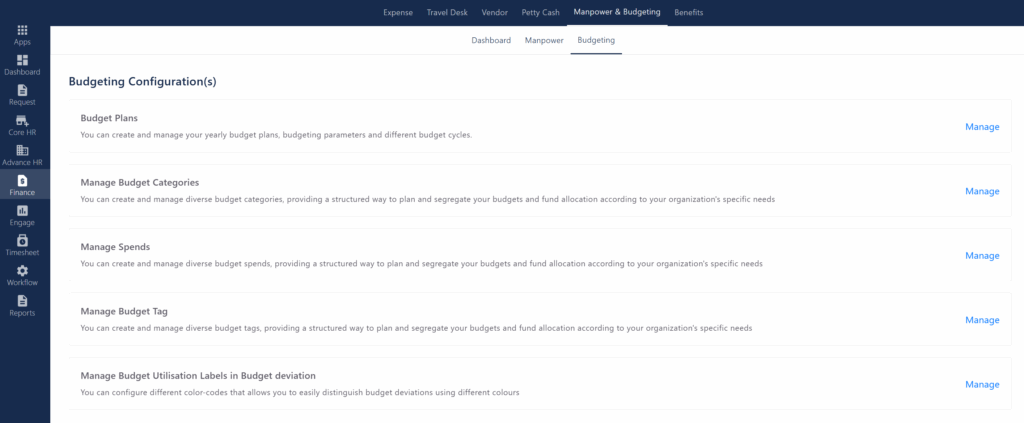
Various features are offered to the user under the budgeting configuration(s)-
Budget Plans:
Create and manage yearly budget plans, parameters, and cycles.

Manage Budget Plans:- Planning Year:
Shows the year for which the budget plan is created. - Budget Cycle:
Indicates the frequency of budget planning (e.g., Half Yearly). - Total Budget Planned:
Displays the total amount allocated for the budget plan. - Parameters:
Lists the criteria (like entity, department, location) used for budgeting. - Total Spend:
Shows the amount spent so far from the planned budget. - Actions (Manage):
Lets you view and edit details of each budget plan.
Budget Plan Details Page:- Budget Plan Status:
Indicates if the budget plan is active. - Budget Cycle & Parameters:
Shows the cycle (e.g., Half Yearly) and parameters used for the plan. - Budget Currency:
Displays the currency for the budget (e.g., Indian Rupee). - Tabs (Overview, Half Yearly 1, Half Yearly 2):
Switch between summary and detailed views for each cycle. - Total Budget / Planned / Remaining Budget:
Shows the overall budget, amount already planned, and what remains. - Cycle Name:
Names of each budget cycle within the year. - Planned Budget:
Amount allocated for each cycle. - Actual Spend:
Amount actually spent in each cycle. - Status:
Indicates if the cycle is “Planned” or “Pending.” - Spend:
Shows the total spend for each cycle. - Actions (View/Plan Now):
Lets you view details or start planning for the cycle. - Progress Bar:
Visual indicator showing how many cycles have been planned.
- Planning Year:
Manage Budget Categories:
Define and organize different budget categories for structured fund allocation.
- Search Bar:
Allows you to search for specific budget categories by name. - Status and Month Filters:
Filter categories based on their active/inactive status and by the month they were added. - Add Category Button:
Lets you create a new budget category. - Category Name:
Displays the name of each budget category (e.g., Expense, Salary), with an option to edit. - Category Type:
Shows the type of category (e.g., Custom). - Added By:
Indicates who created the budget category. - Added On:
Displays the date the category was created. - Status:
Shows if the category is currently Active or Inactive. - Actions (Three Dots):
Provides options to Inactivate/Activate or Delete a category. - Rows per Page Selector:
Allows you to set how many categories are displayed per page.
- Search Bar:
Manage Spends:
Set up and monitor various types of budget expenditures.
Various features that are available to the user after clicking manage spends are-- Search Bar:
Allows you to quickly find specific spend entries or categories. - Year, Status, Month, Cycle Filters:
Filter spend data by financial year, status (active/inactive), month, or budget cycle for targeted viewing. - Add Spend Button:
Lets you manually add a new spend entry to a budget category. - Bulk Add Spend Button:
Enables uploading multiple spend entries at once, saving time on data entry. - Category Name:
Lists the names of budget categories (e.g., Expense, Salary) to which spends are assigned. - Category Type:
Shows the type of each category (e.g., Custom). - Total Spend Added:
Displays the total amount of spend recorded for each category. - Rows per Page Selector & Pagination:
Allows you to choose how many rows to display per page and navigate through multiple pages of spend data.
- Search Bar:
Manage Budget Tag:
Create and manage tags to classify and segregate budget items.
Various features available to users after clicking ‘Manage Budget Tags’ include-- Tag Name:
Displays the name of each budget tag (e.g., Expense). - Added By:
Shows who created or added the tag. - Added On:
Indicates the date the tag was created. - Actions (Three Dots):
Provides options to manage or edit the tag. - Take Action (Add Tags):
Button to add new budget tags to the list. - Rows per Page Selector & Pagination:
Allows you to set how many tags are displayed per page and navigate between pages.
- Tag Name:
Manage Budget Utilization Labels in Budget deviation:
Configure color-coded labels to easily identify and distinguish budget deviations. Various features available to users after clicking ‘Manage Budget Tags’ include-
At Risk (Red):
Label for budgets where deviation is more than 50%. Highlights critical overspending.Needs Attention (Yellow):
Label for budgets where deviation is more than 20% and less than 50%. Indicates significant overspending that requires monitoring.Under Control (Green):
Label for budgets where deviation is more than 10% and less than 20%. Shows budgets are mostly within acceptable limits.Need Reconsideration (Blue):
Optional label for custom deviation thresholds (toggle off in the image). Can be used for additional status if enabled.Color Codes & Toggles:
Each label has a color and an on/off toggle to activate or deactivate that category.Deviation Thresholds:
Set the percentage range for each label to automatically categorize budget deviations.