Dashboard
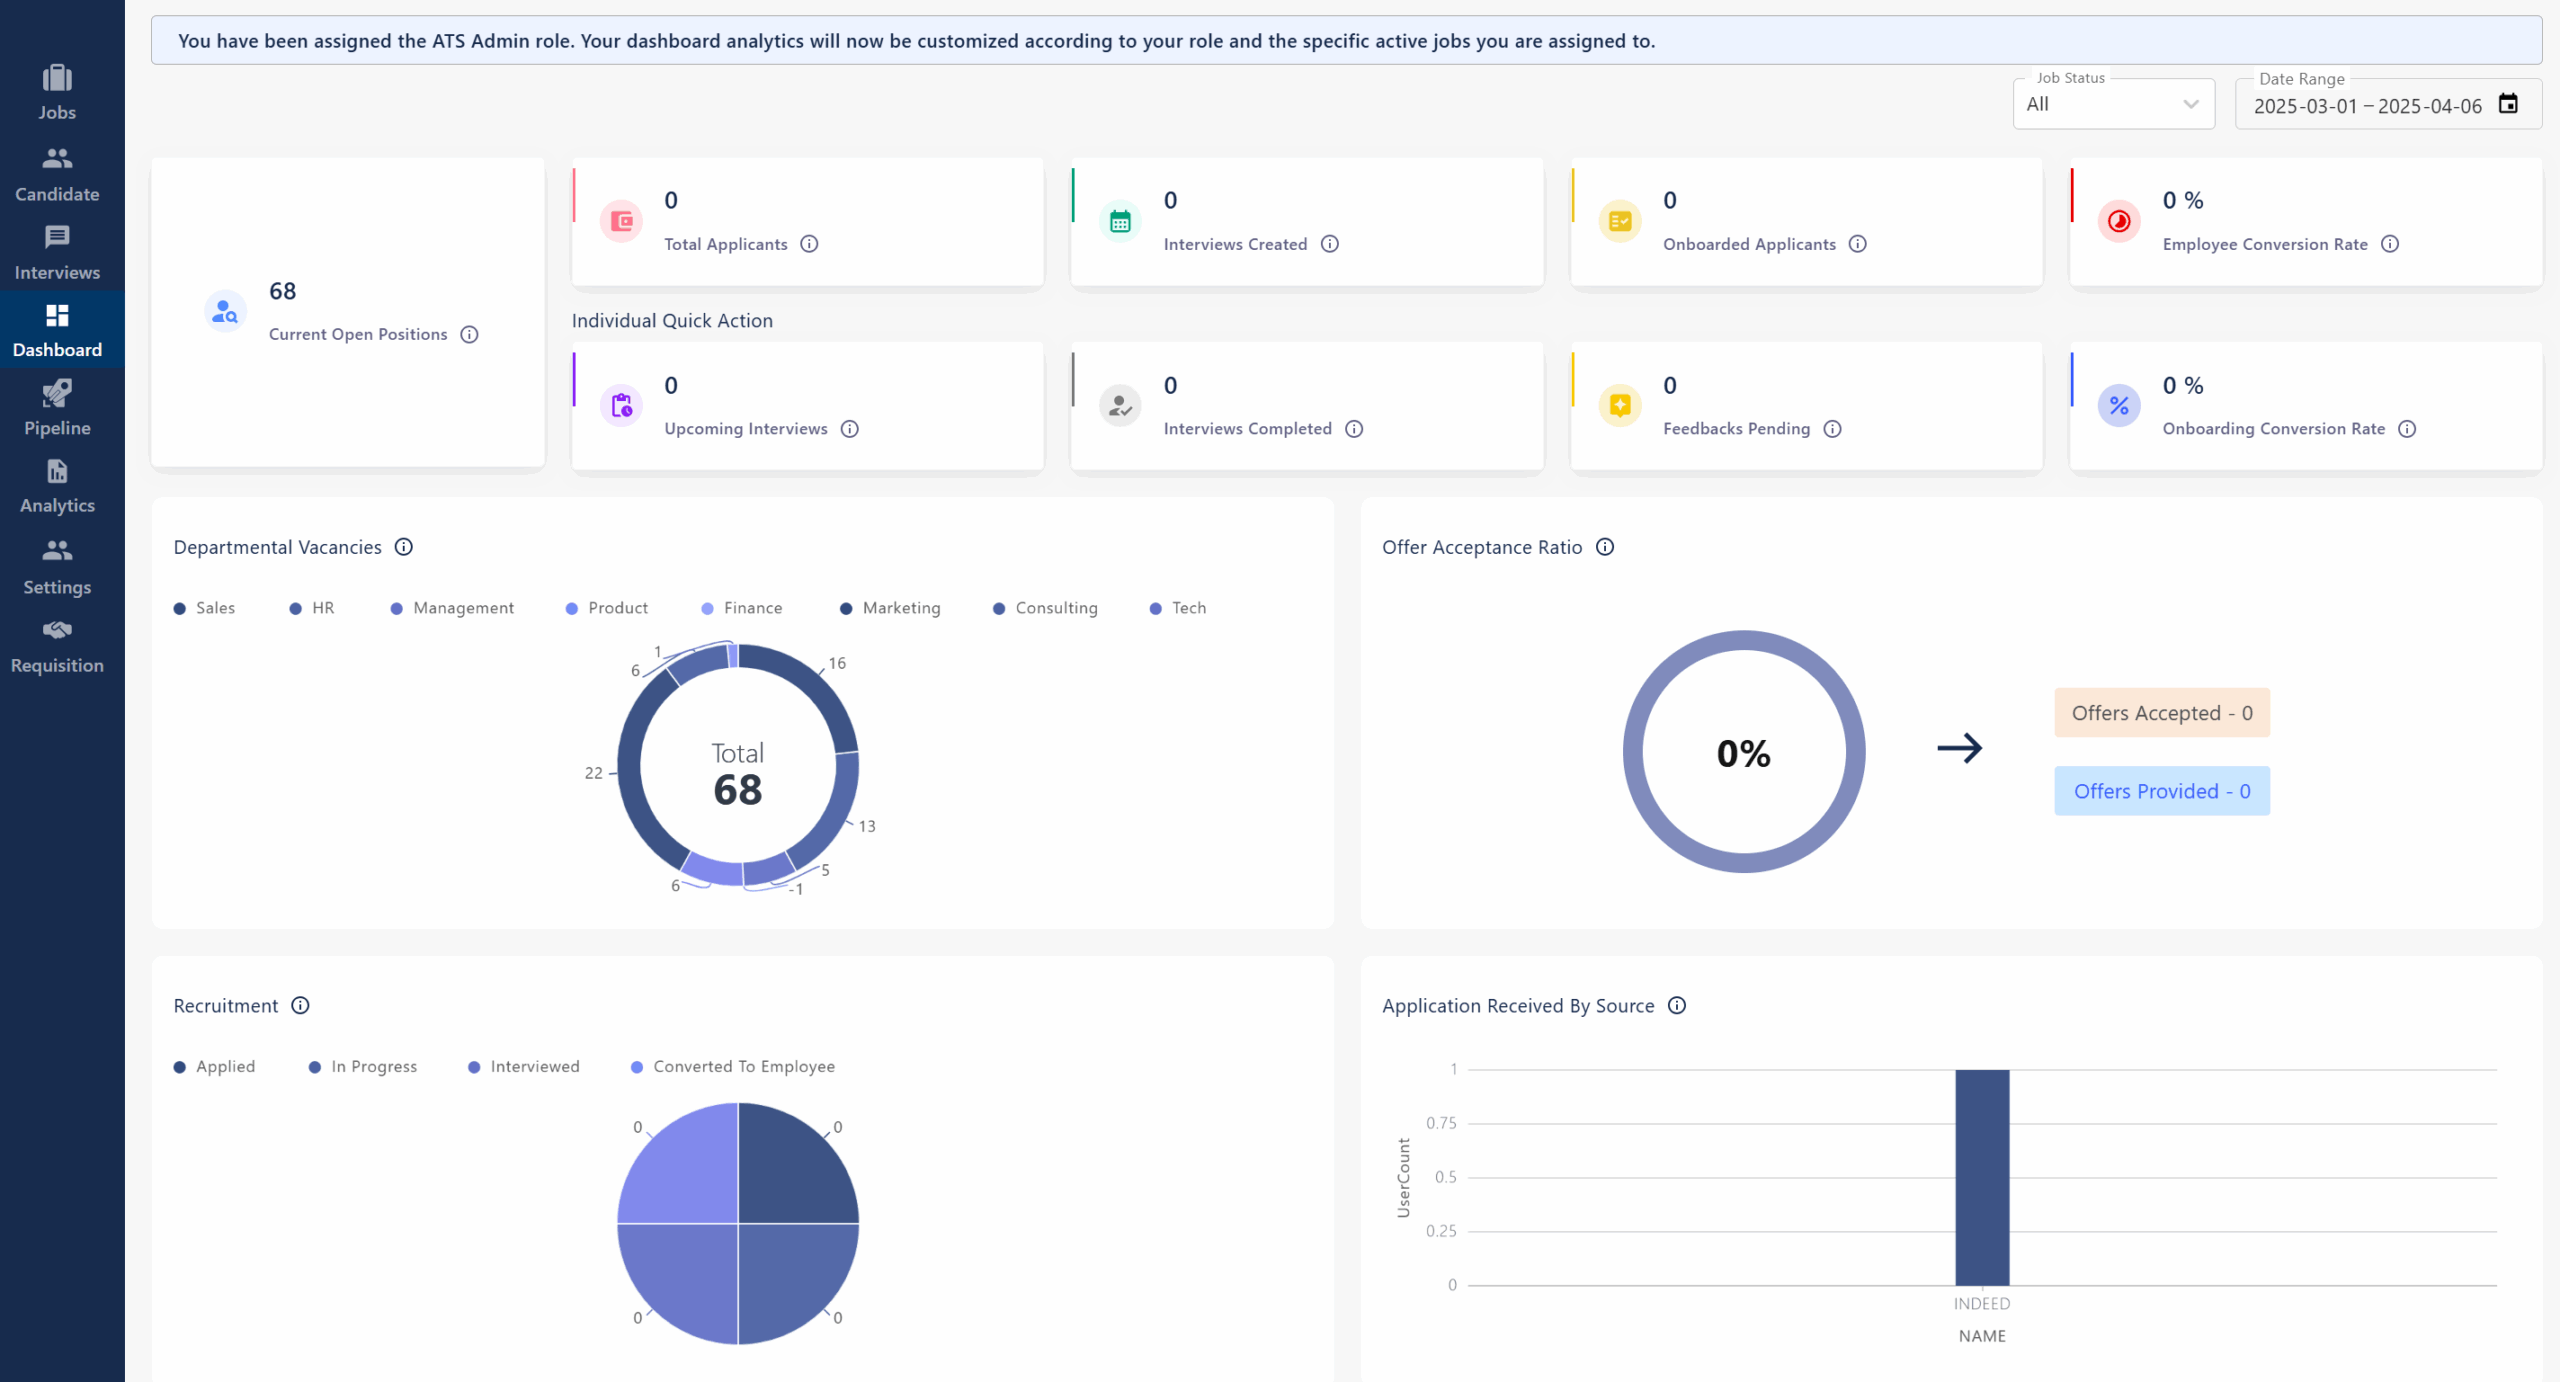
- Current Open Positions:
Displays the total number of job openings available at the moment. - Total Applicants, Interviews Created, Onboarded Applicants:
Shows counts for applicants, scheduled interviews, and candidates who have completed onboarding. - Employee Conversion Rate & Onboarding Conversion Rate:
Tracks the percentage of applicants converted to employees and the percentage of onboarded candidates. - Individual Quick Action (Upcoming Interviews, Interviews Completed, Feedbacks Pending):
Quick stats for interviews scheduled, finished, and feedback yet to be submitted. - Departmental Vacancies:
Visualizes open positions by department (e.g., Sales, HR, Finance, Tech) in a circular chart. - Offer Acceptance Ratio:
Displays the percentage of accepted offers out of those provided, with counts for each. - Recruitment Funnel:
Pie chart showing the status of candidates (Applied, In Progress, Interviewed, Converted to Employee). - Application Received by Source:
Bar graph showing the number of applications received from different sources (e.g., Indeed). - Average Time to Hire:
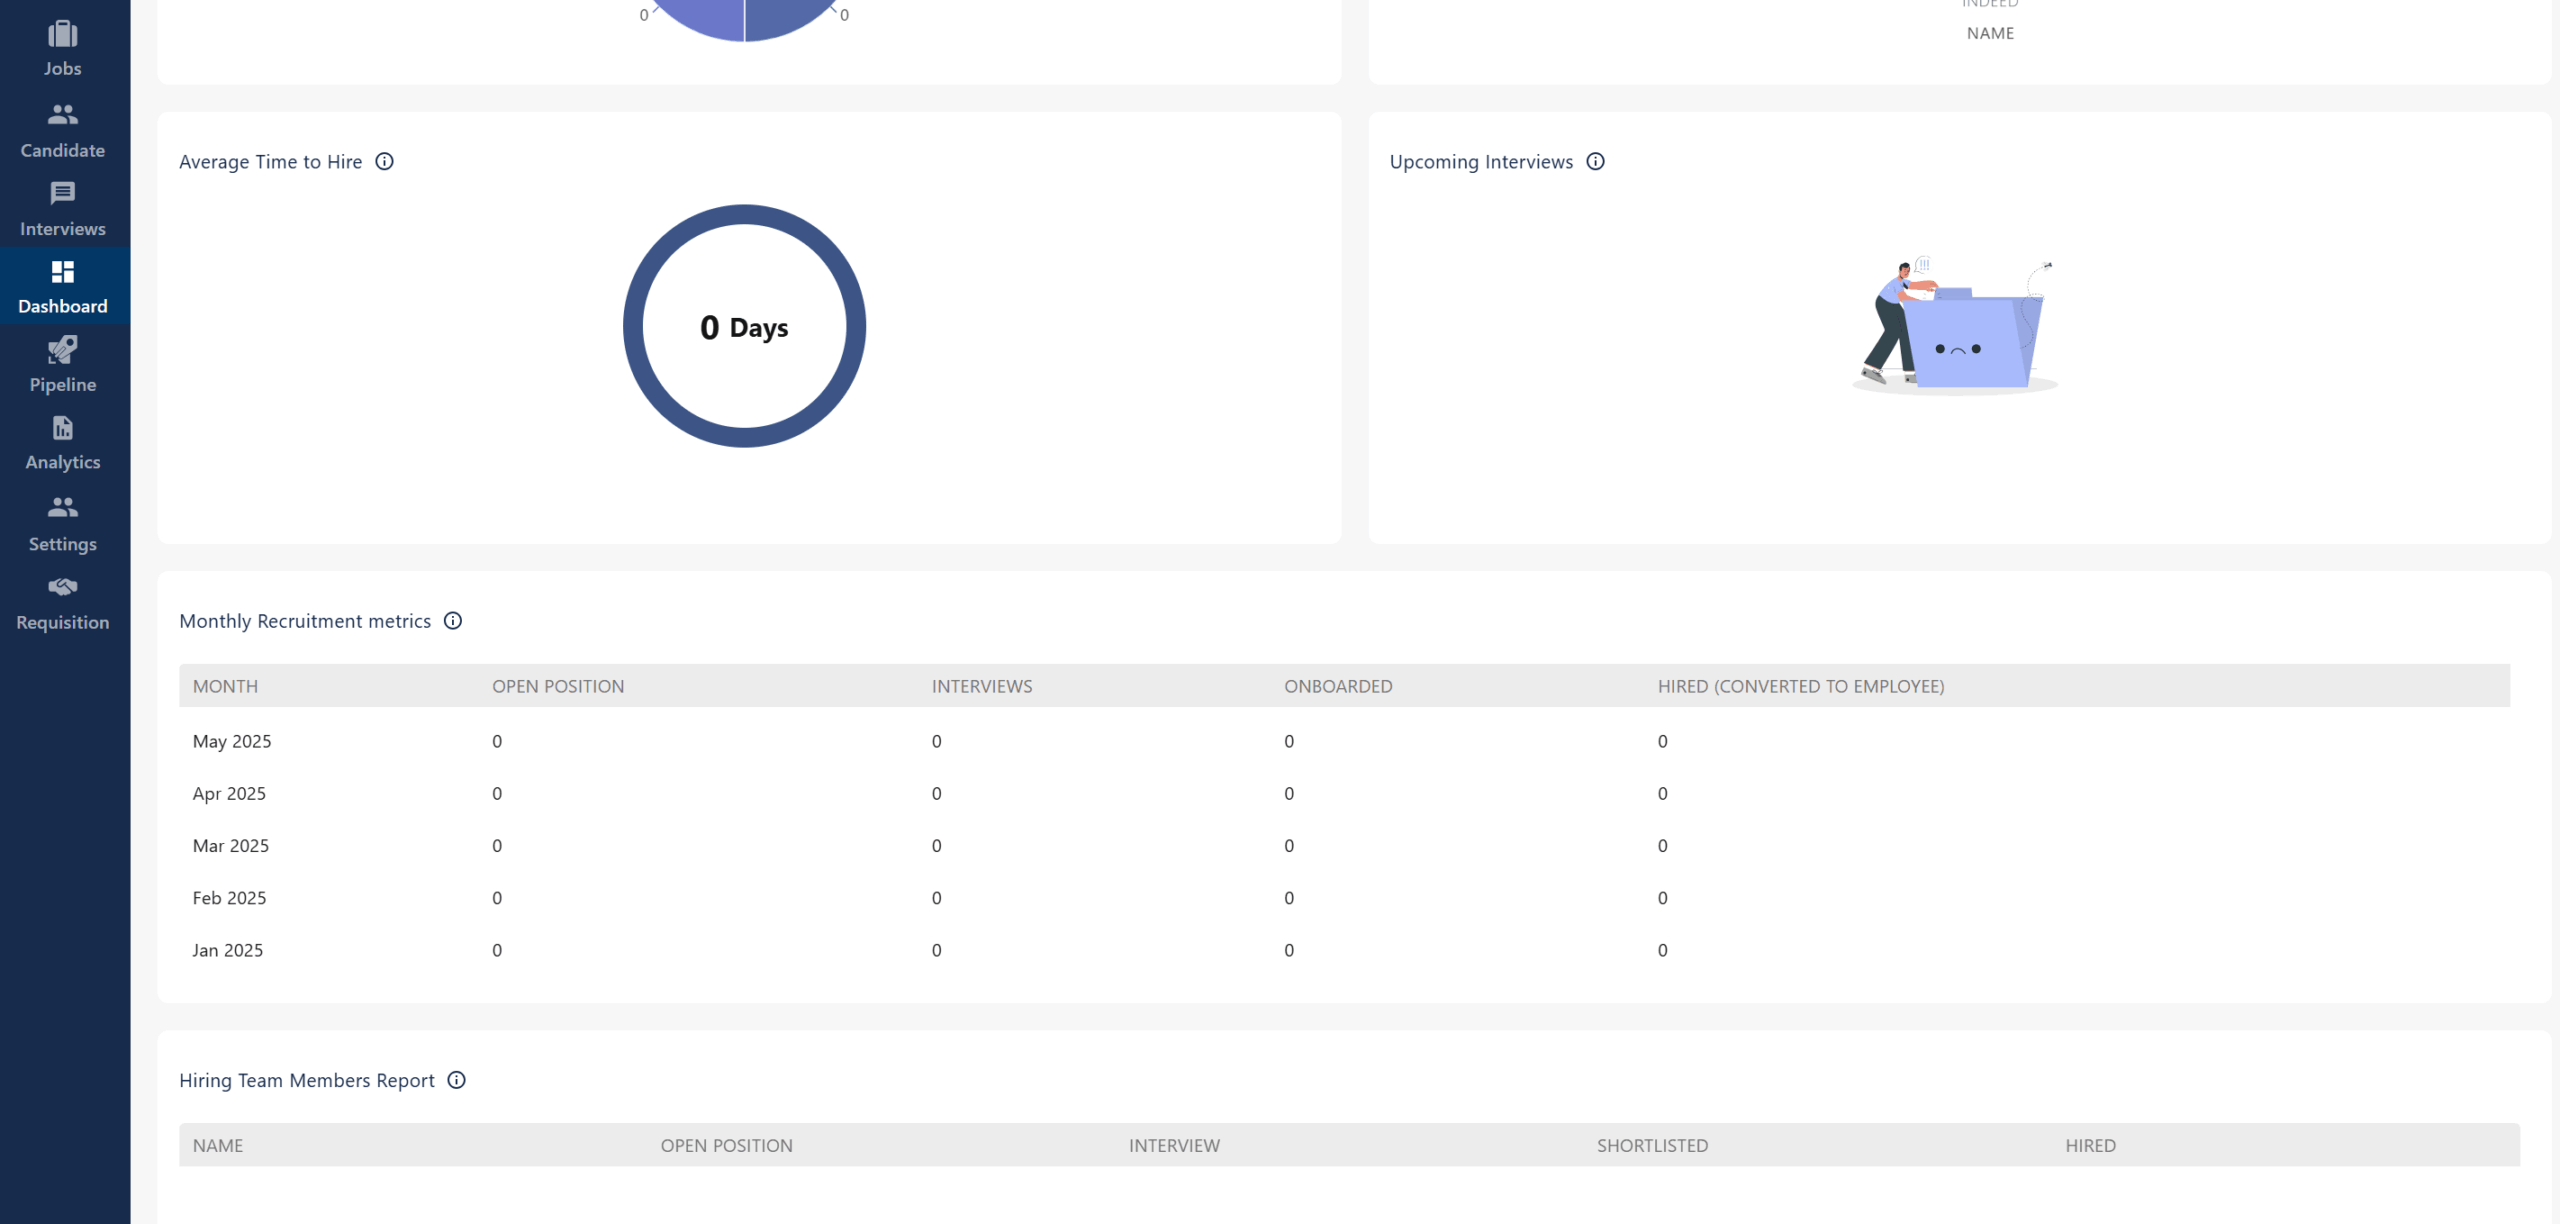
Shows the average number of days taken to fill a position. - Upcoming Interviews:
Visual indicator for scheduled upcoming interviews. - Monthly Recruitment Metrics:
Table summarizing open positions, interviews, onboarded, and hired candidates for each month. - Hiring Team Members Report:
Table listing hiring team members with their open positions, interviews conducted, shortlisted, and hired candidates.