Zimyo Performance Management empowers organizations to track and enhance employee productivity through real-time goal alignment, continuous feedback, and data-driven insights. The module integrates OKRs (Objectives and Key Results) to break down organizational targets into measurable individual goals, tracked via dynamic dashboards. 360-degree feedback ensures holistic evaluations from peers, managers, and stakeholders, reducing bias. Automated appraisal cycles and tools like the 9-Box Matrix simplify talent categorization, while Performance Snapshots provide visual progress summaries. Seamless payroll integration links outcomes to rewards, fostering motivation. Trusted by 2,000+ businesses globally, Zimyo streamlines reviews, boosts engagement, and aligns daily tasks with strategic objectives for scalable growth.
Review
Quick Actions
Performance Dashboard Admin Overview
The Performance Admin Dashboard in Zimyo provides administrators with a clear, real-time overview of all key activities and pending actions in the performance management cycle. This dashboard helps HR and managers track progress, identify bottlenecks, and ensure timely completion of performance-related tasks.
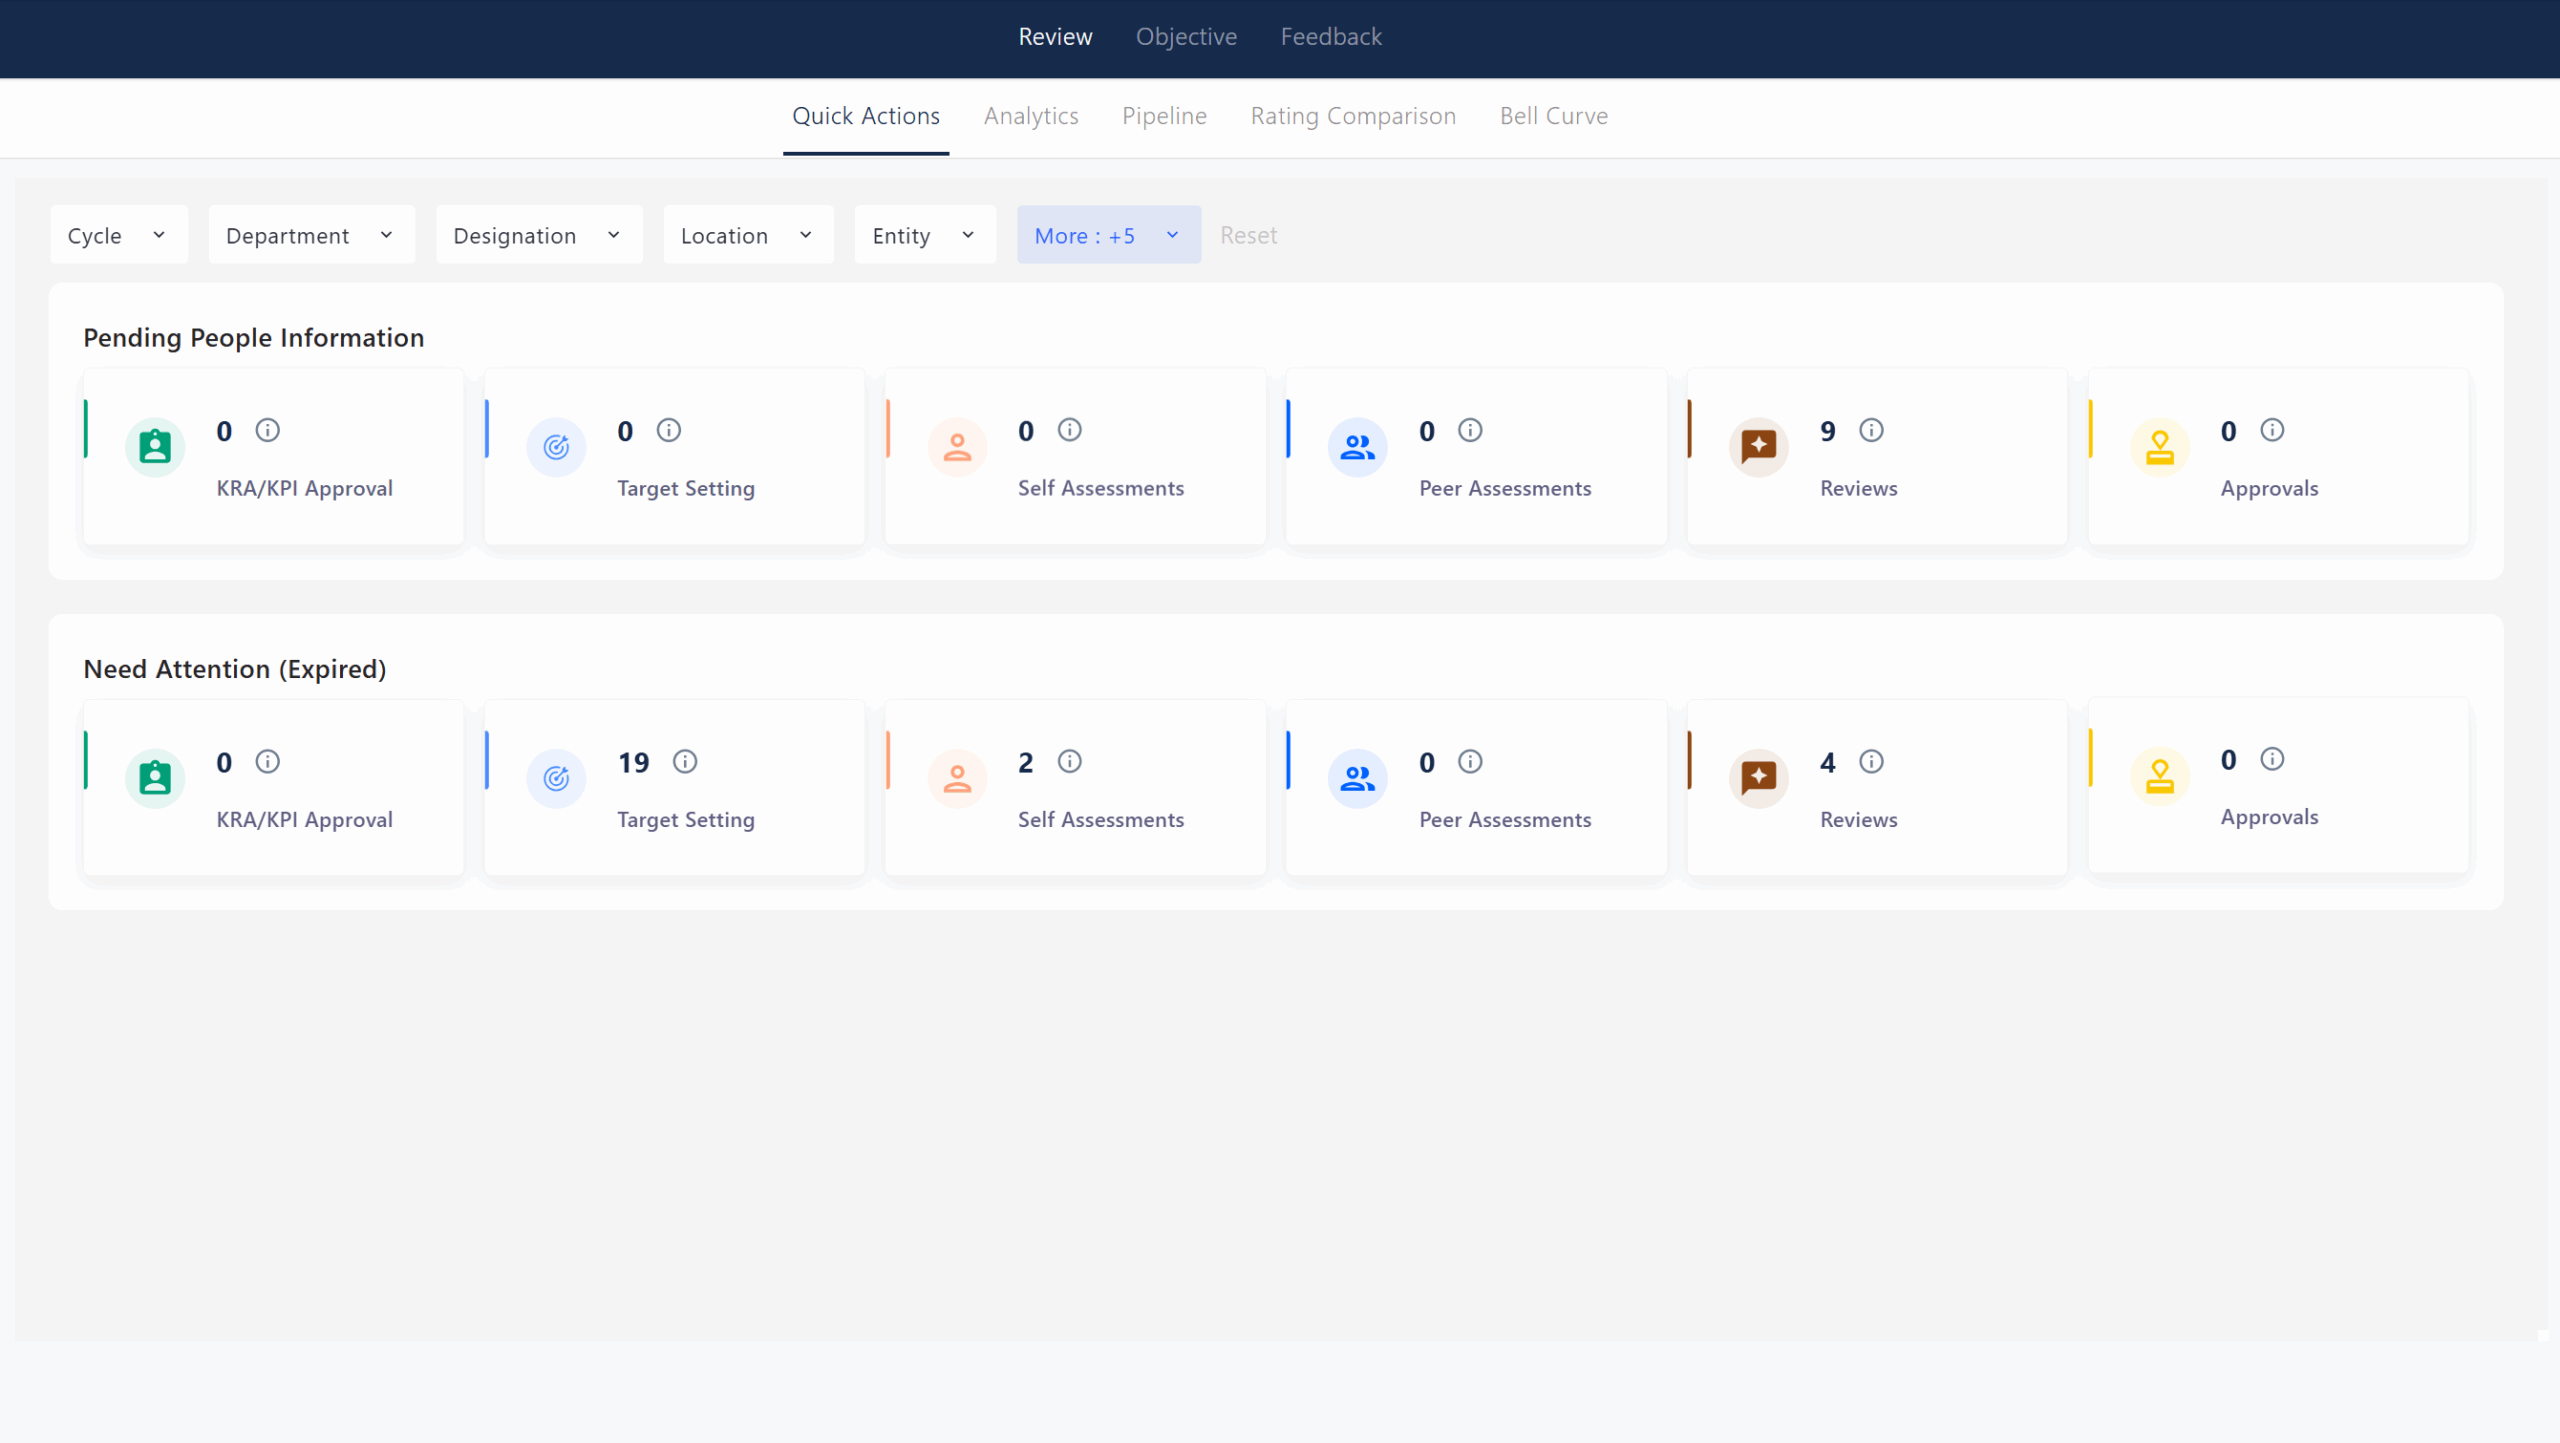
Pending People Information
This section displays the number of employees or items awaiting action in each stage of the performance process:
- KRA/KPI Approval: Shows how many employees have submitted their Key Result Areas (KRA) or Key Performance Indicators (KPI) that are pending manager or admin approval.
- Target Setting: Indicates employees who still need to set their performance goals or targets. For example, if the number is 9, nine employees have not yet completed their target-setting process.
- Self Assessments: Displays employees who have not yet filled out their self-assessment forms, which are crucial for 360-degree feedback and performance reviews.
- Peer Assessments: Shows pending peer reviews, where colleagues are expected to provide feedback on each other’s performance.
- Reviews: Highlights the number of performance reviews that managers or reviewers still need to complete.
- Approvals: Indicates any final approvals pending for completed performance cycles, such as appraisals or recommendations.
Need Attention(Expired)
This section highlights items that have passed their deadlines and need immediate attention:
- Expired KRA/KPI Approval: Number of KRA/KPI submissions not approved within the set timeframe.
- Expired Target Setting: Employees who missed the deadline to set their targets.
- Expired Self Assessments: Self-assessments not completed before the deadline.
- Expired Peer Assessments: Peer feedback that is overdue.
- Expired Reviews: Performance reviews that were not finished on time.
- Expired Approvals: Final approvals that are overdue and may delay the appraisal process.
Analytics
The Analytics Dashboard in Zimyo Performance provides admins and HR with a visual, data-driven overview of employee performance trends and organizational achievements. Here’s a breakdown of the features and sections visible on this page:
Reviews Distribution By Stage
This widget displays the current status of performance reviews across different stages (e.g., not started, in progress, completed). It helps admins quickly identify bottlenecks in the review process. If no reviews are in the system, it will show “No review data found.”
Organization Achievement
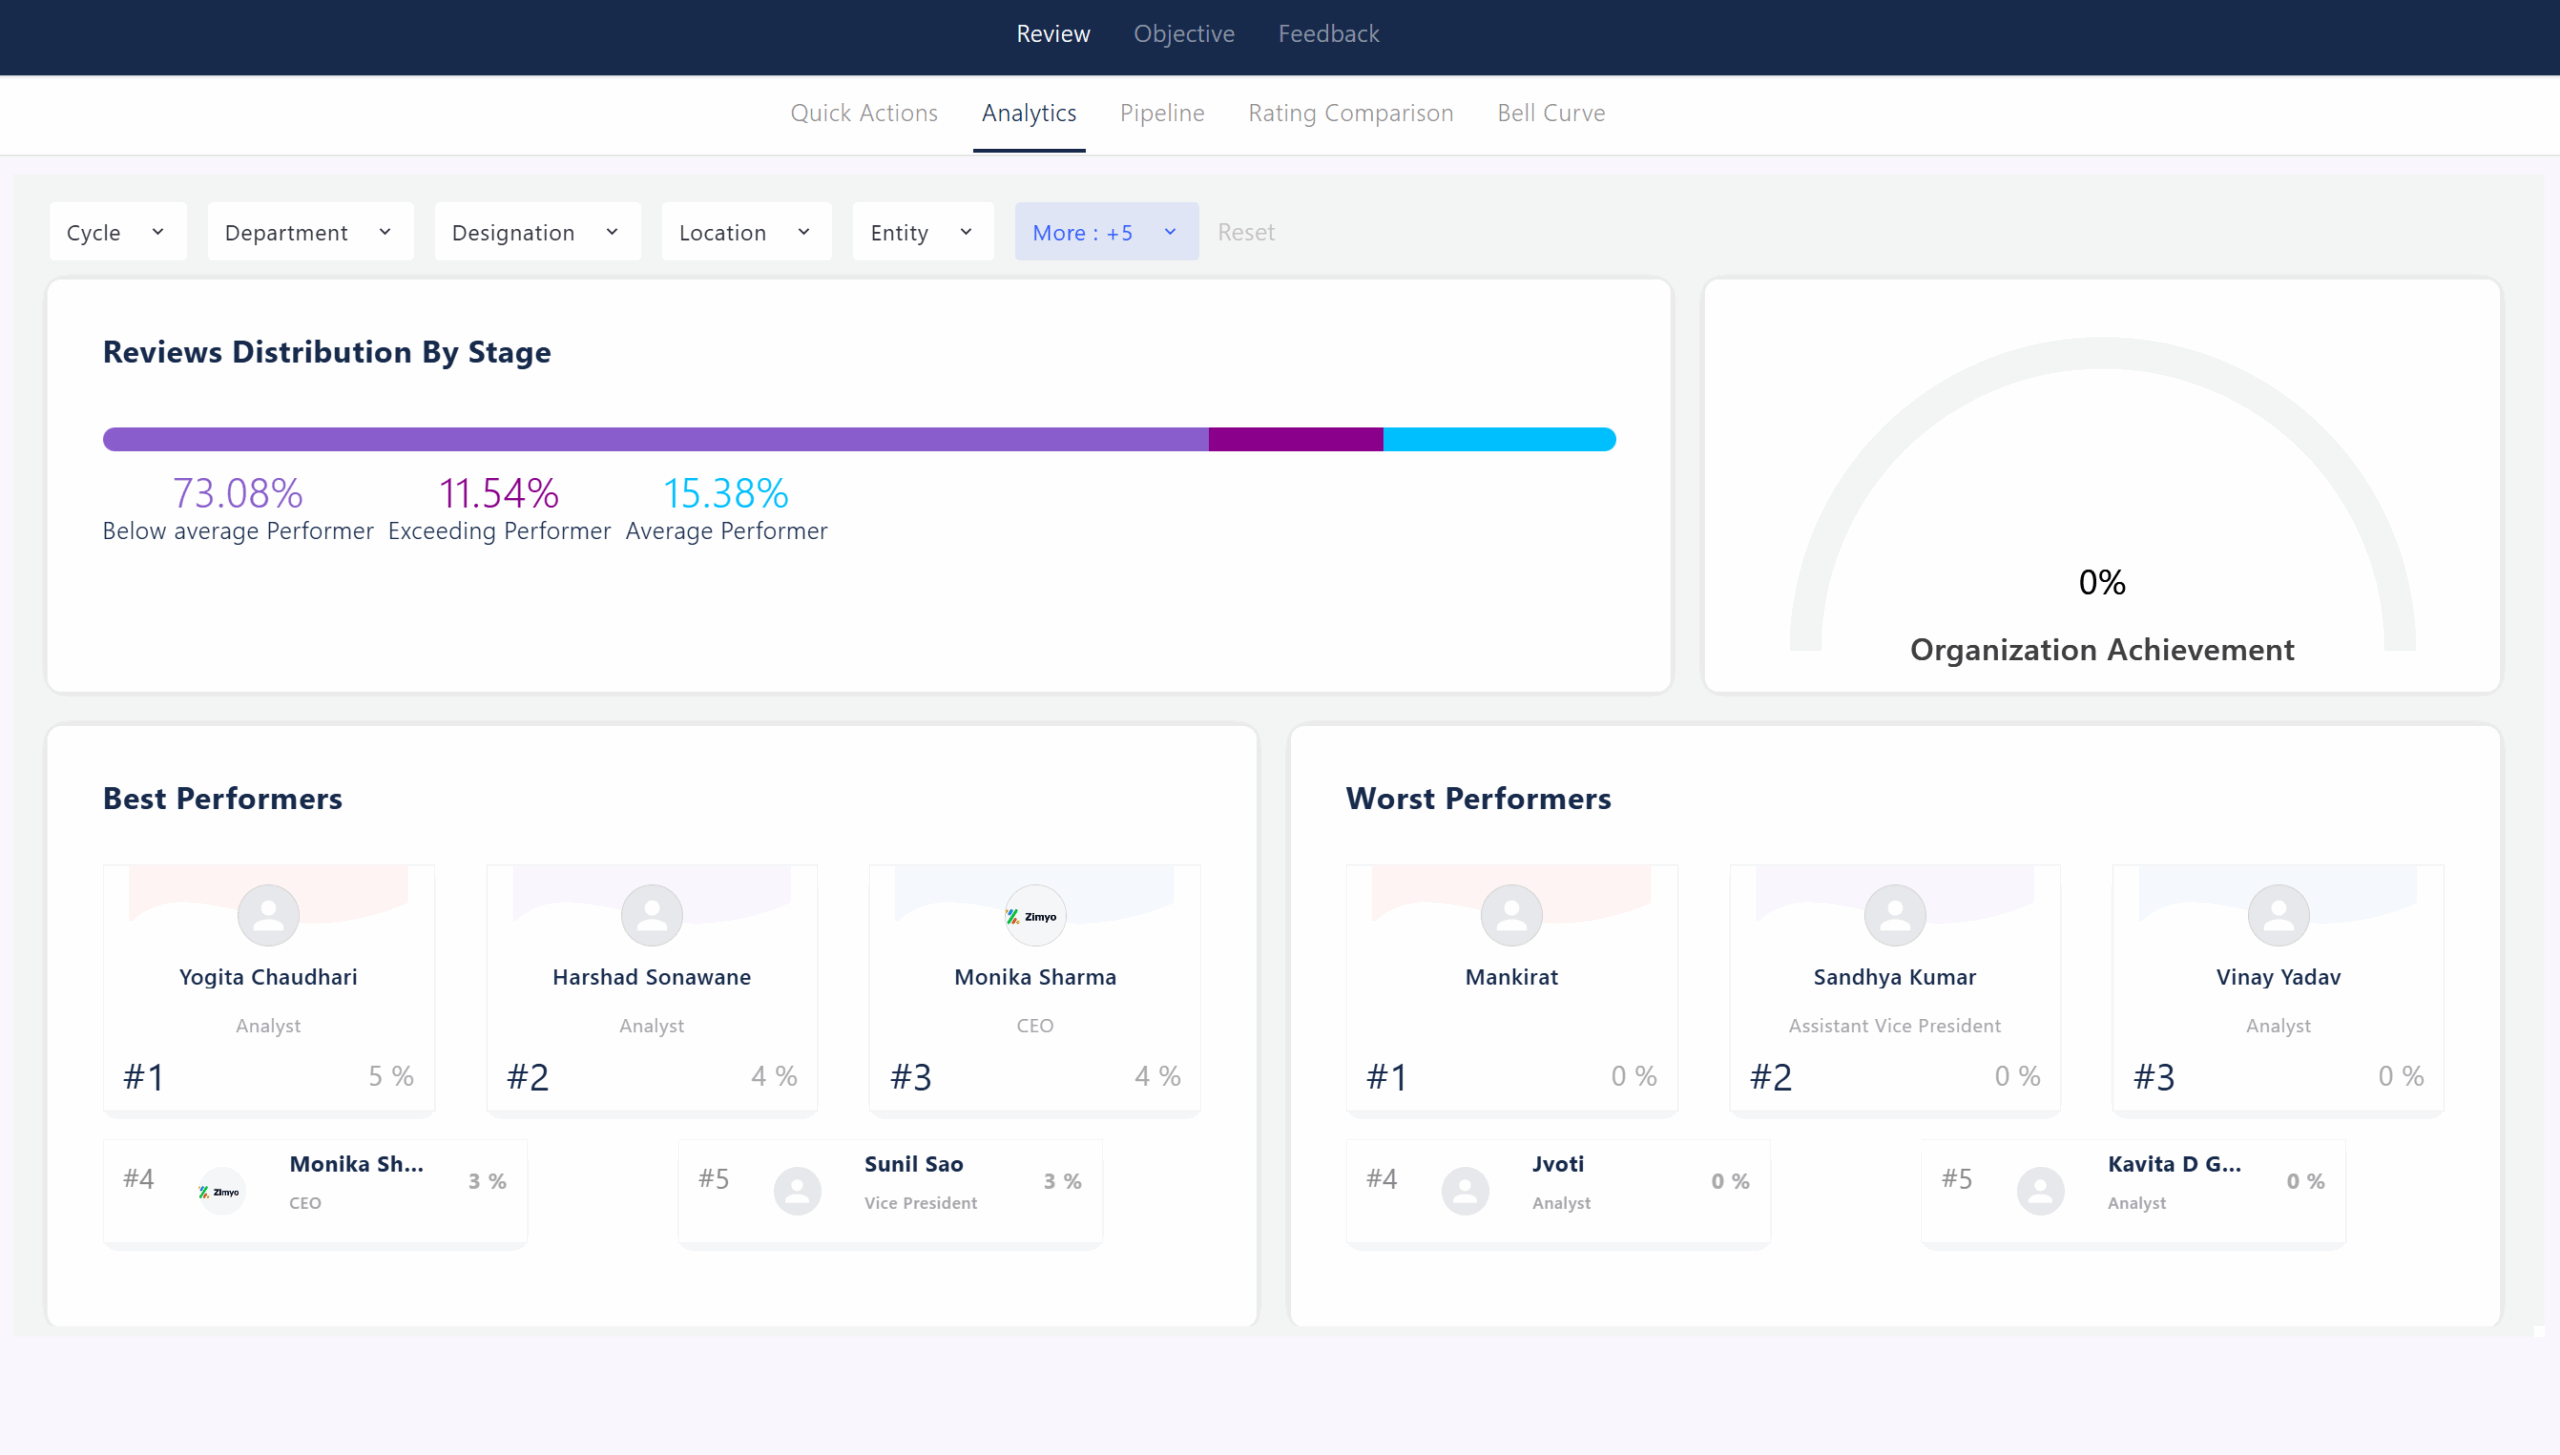
This gauge shows the overall percentage of organizational goals achieved based on set objectives and key results (OKRs). It provides a quick snapshot of how close the organization is to meeting its performance targets.
Best Performers
This section highlights top-performing employees based on their performance ratings. It helps recognize and celebrate high achievers. If there are no qualifying employees yet, it will display “No employees here.”
Worst Performers
This area lists employees with the lowest performance ratings, helping managers identify who may need additional support, training, or intervention. Each entry includes the employee’s name, designation, and performance percentage.
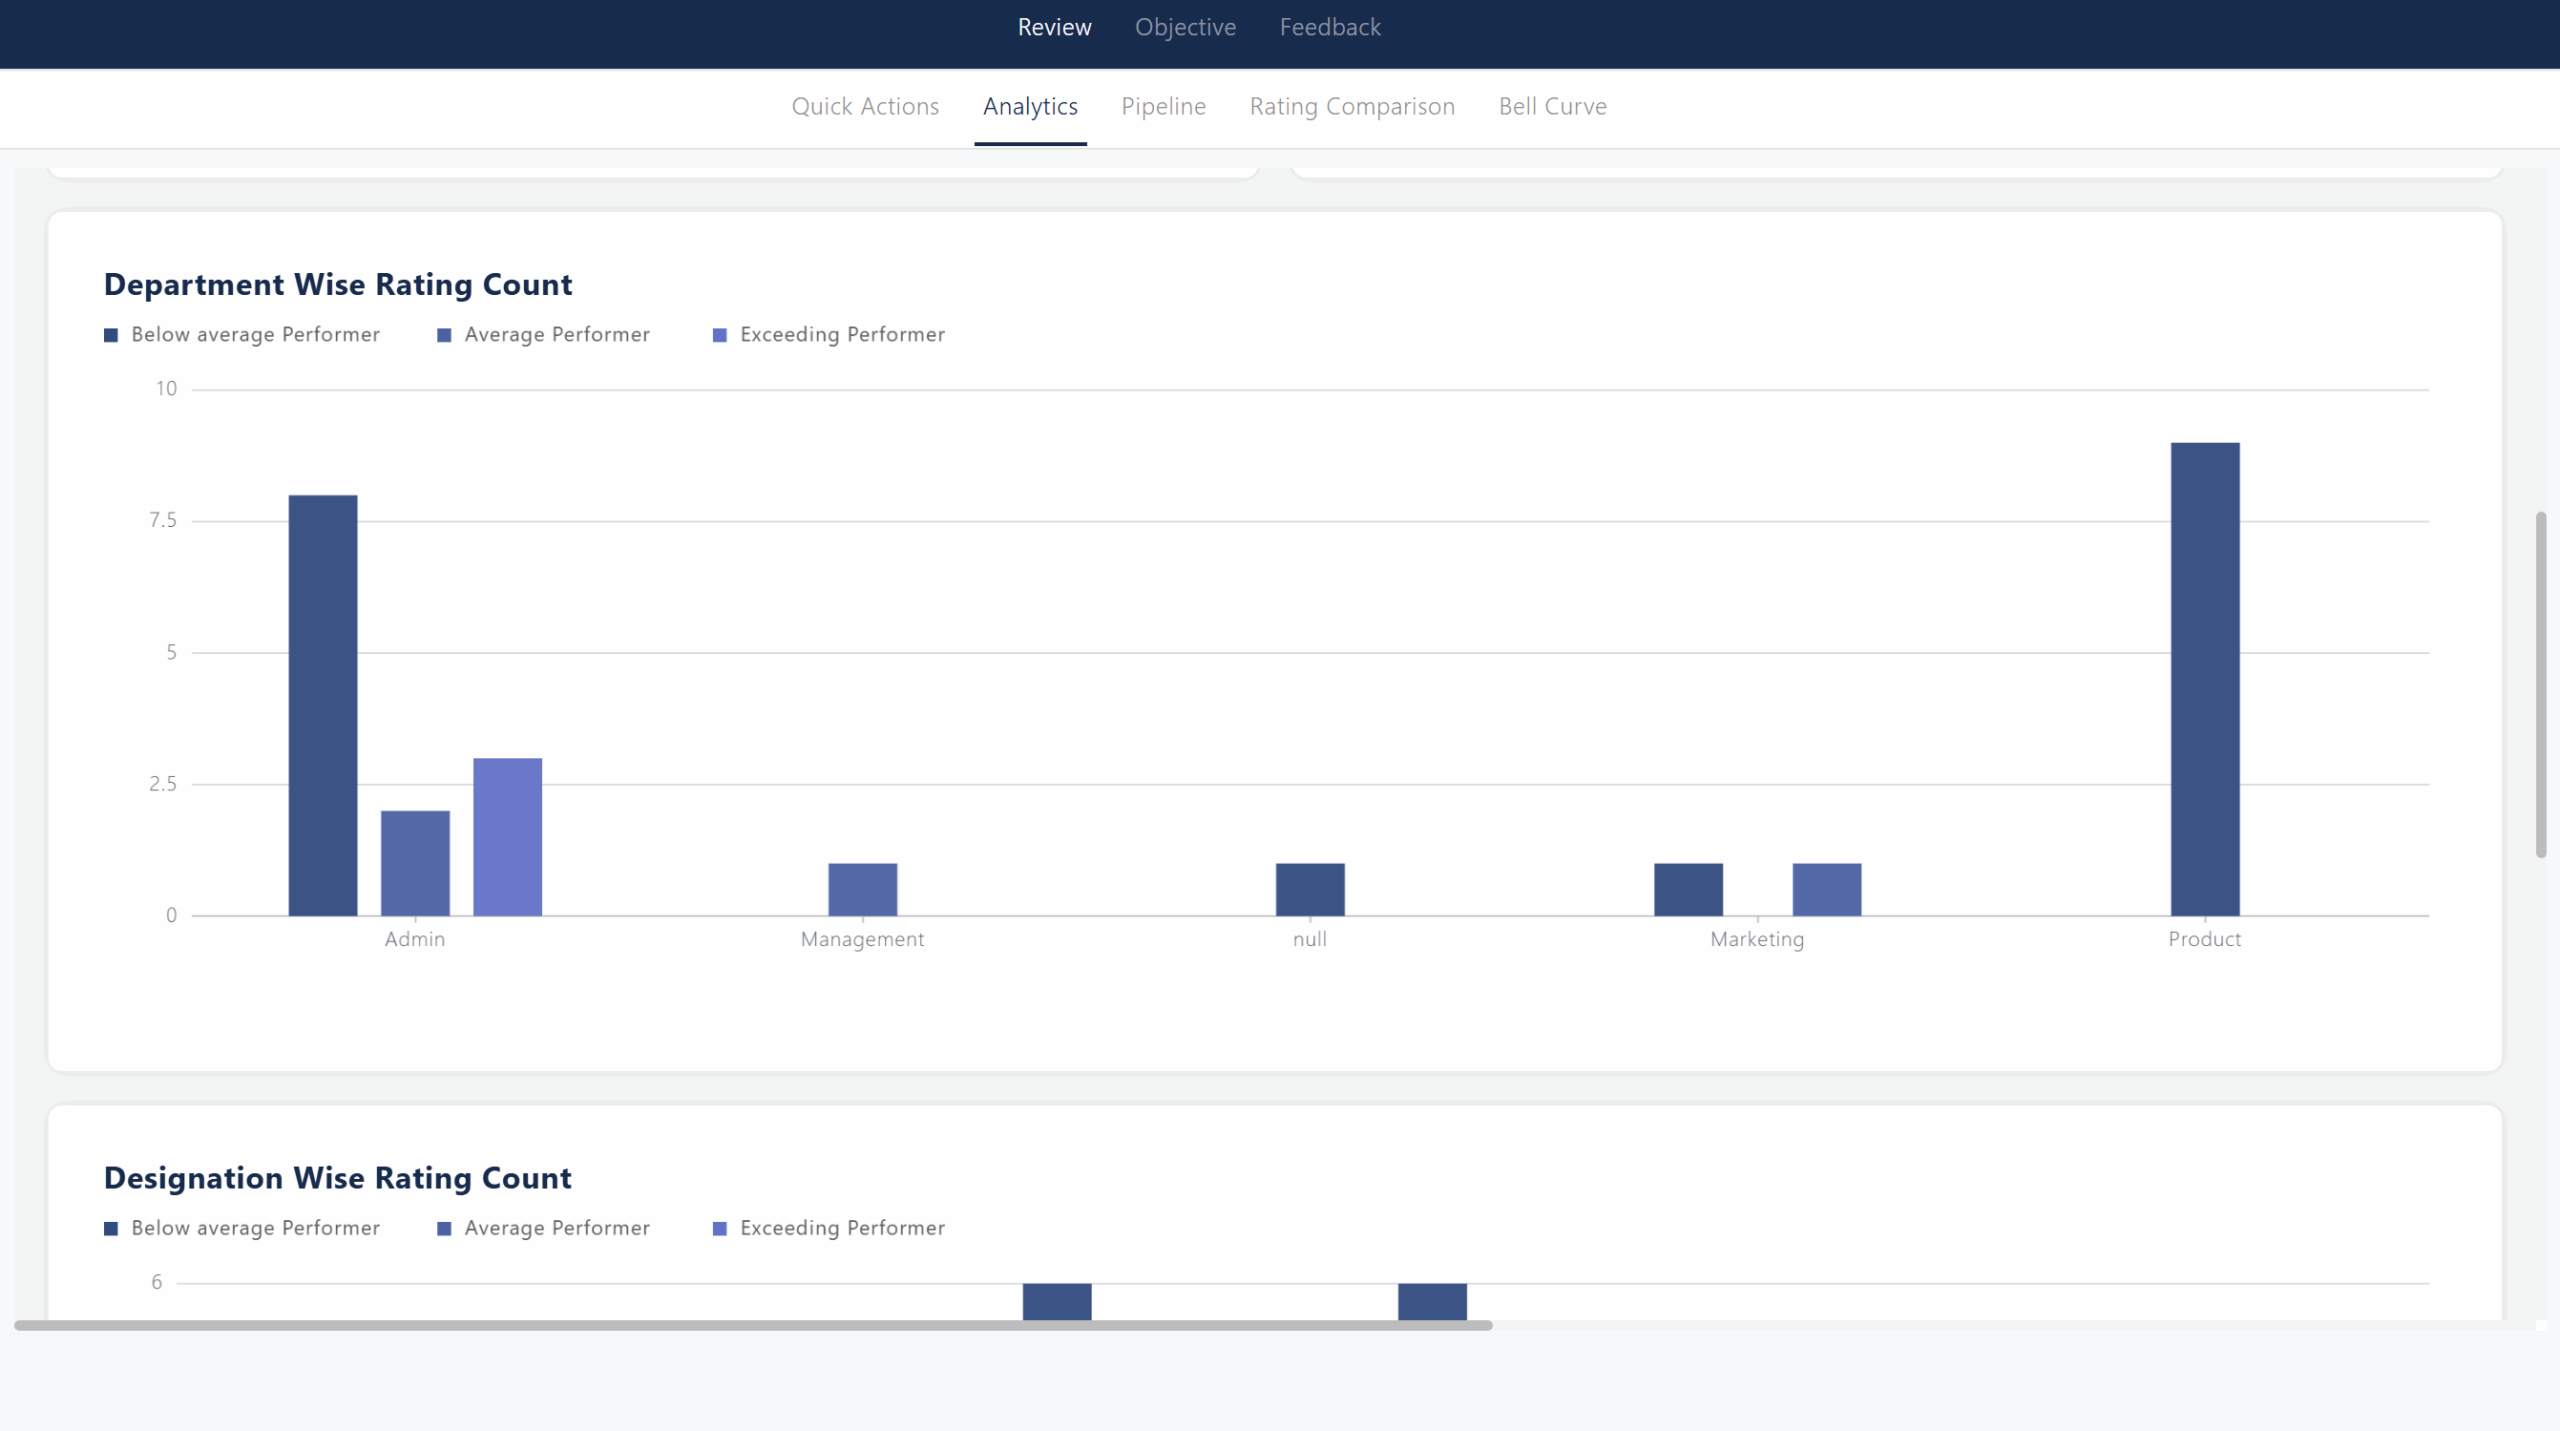
Department Wise Rating Count
This bar chart visualizes the number of performance ratings distributed across different departments (e.g., Admin, Finance, HR). It helps in understanding which departments have completed more reviews or have higher/lower engagement in the appraisal process.
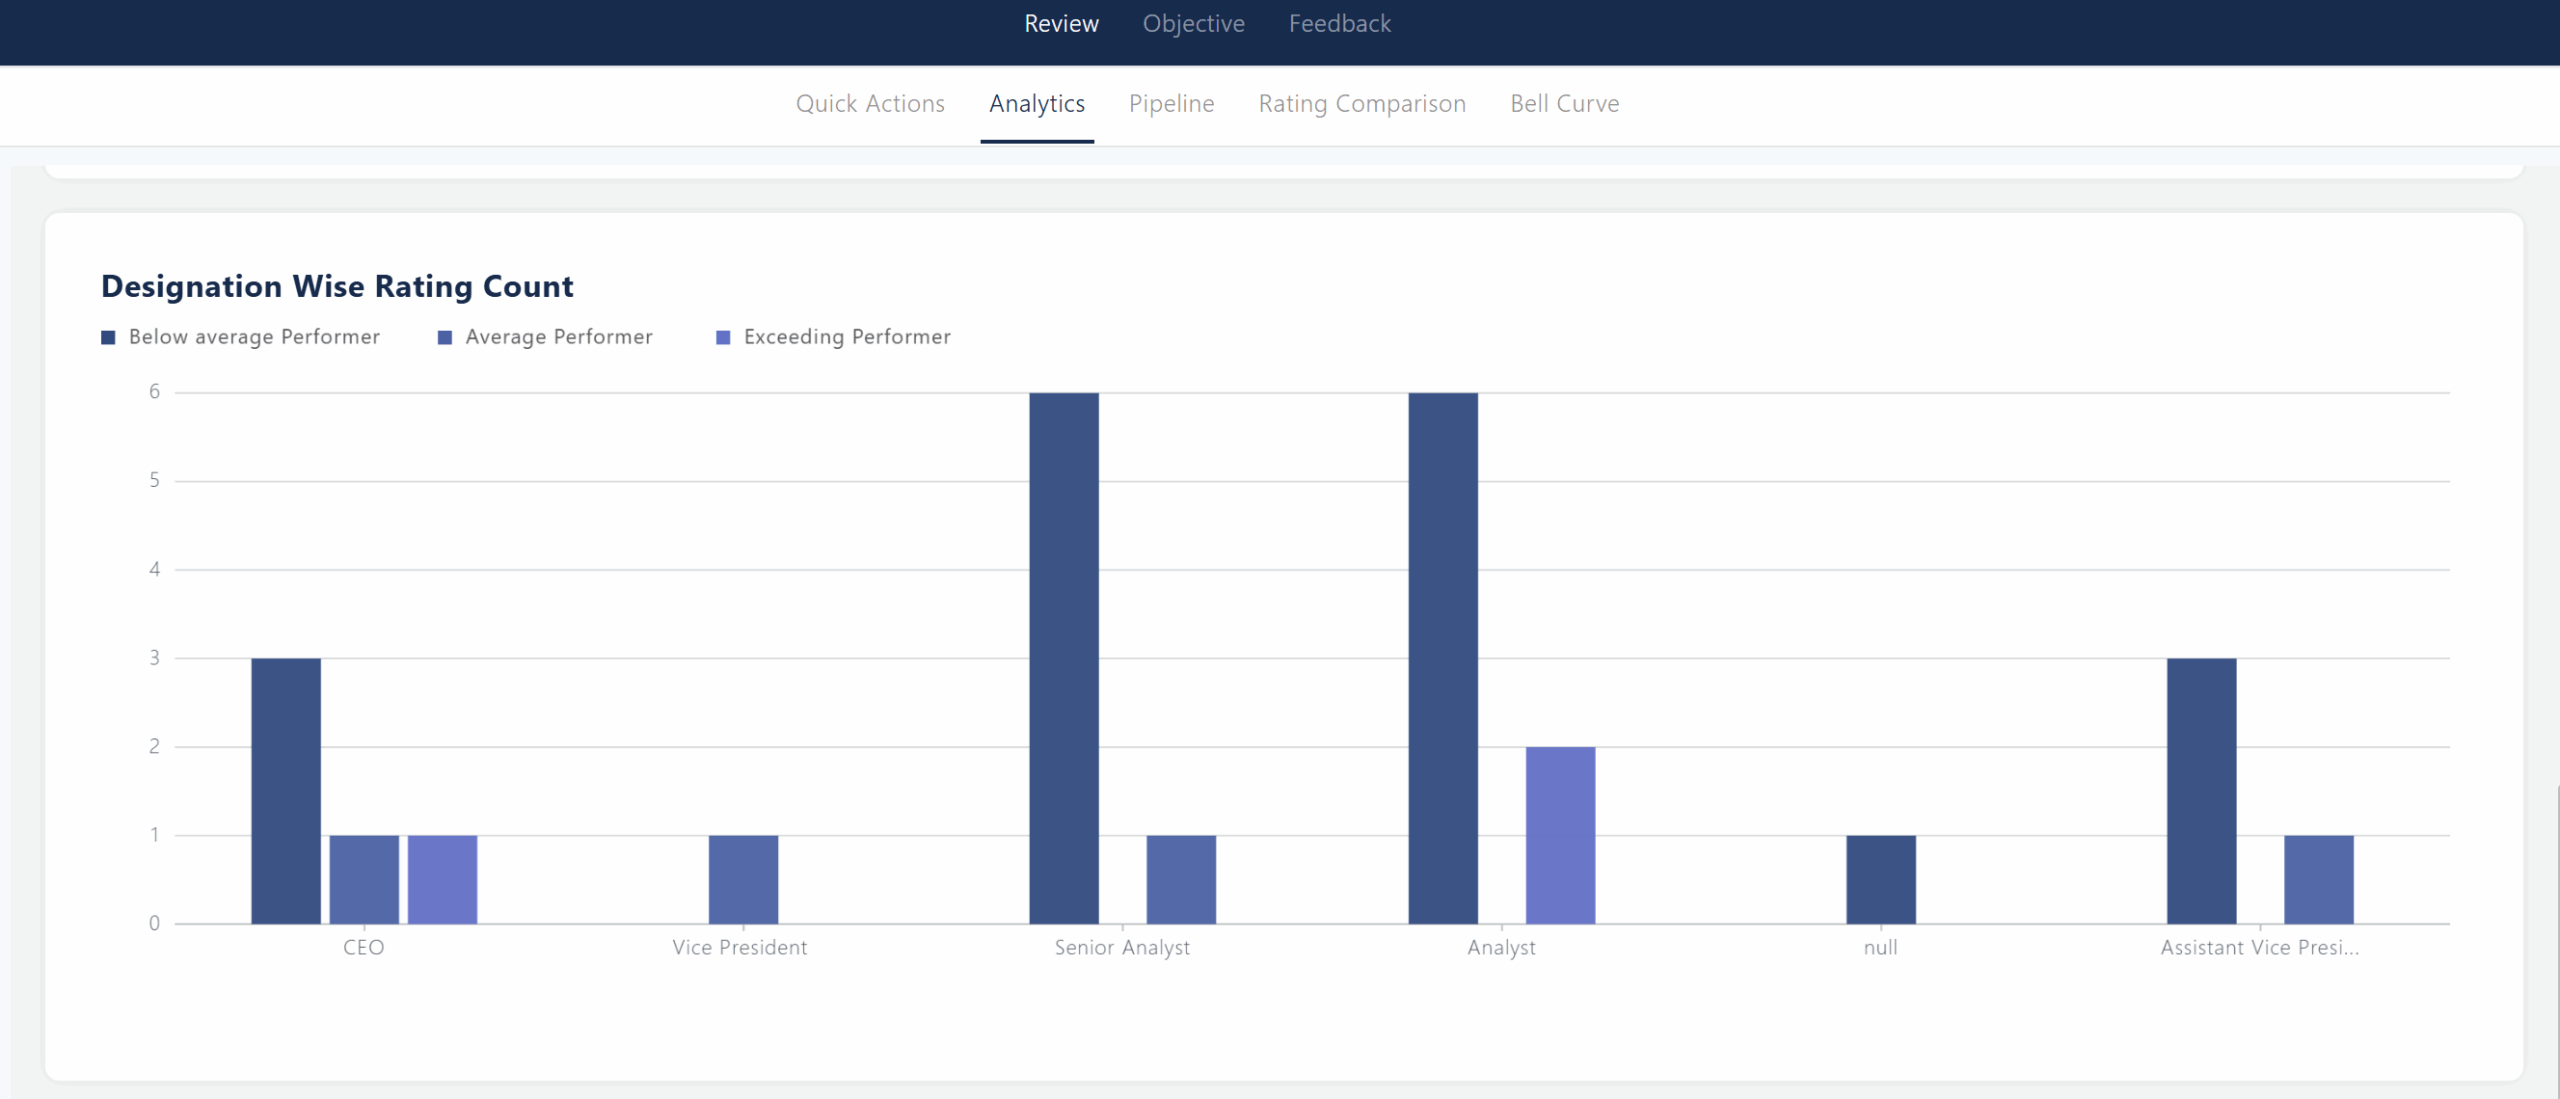
Designation Wise Rating Count
Similar to the department chart, this bar graph shows the distribution of performance ratings across various designations (e.g., Assistant Manager, Analyst, Vice President). It enables easy comparison of appraisal activity and outcomes by role.
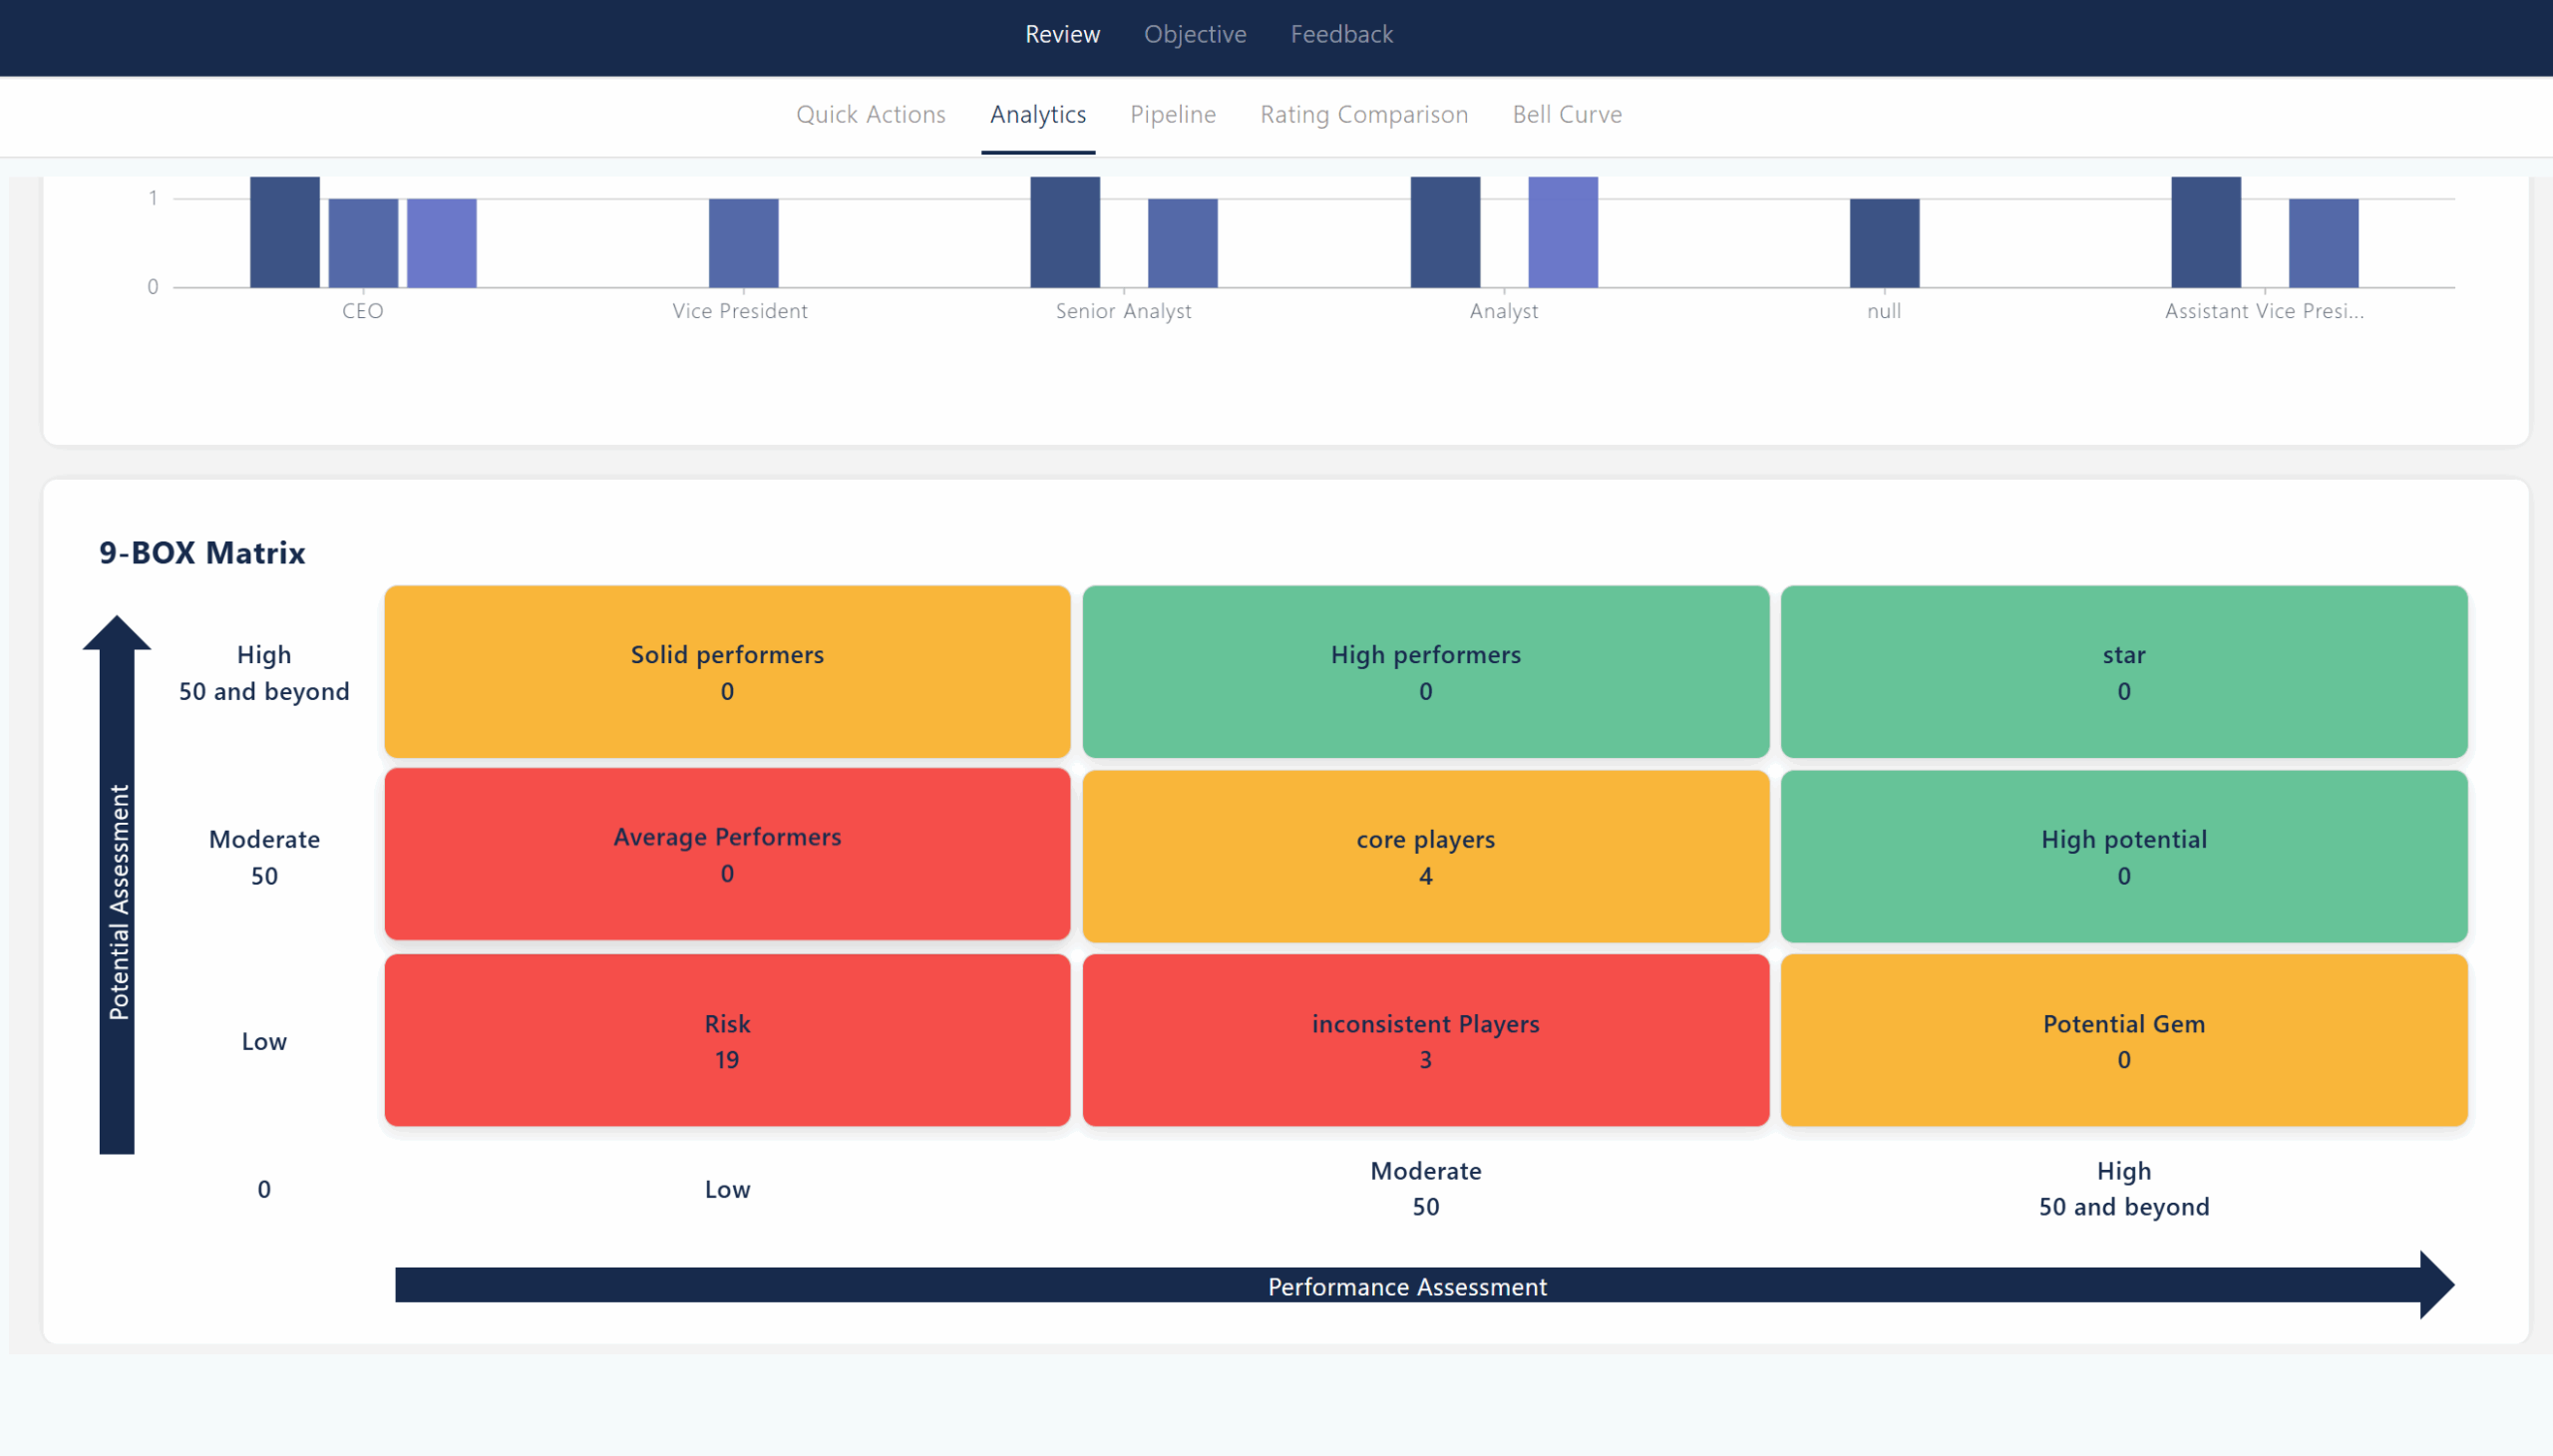
9-Box Matrix
The 9-Box Matrix is a strategic talent management tool that plots employees based on their performance (horizontal axis) and potential (vertical axis). Categories include “top talent,” “core player,” “potential talent,” and “bad hire,” among others. This matrix helps HR identify high-potential employees for leadership development and flag those who may need improvement or reassignment.
Pipeline
The Pipeline view in Zimyo Performance provides a visual, stage-wise breakdown of the performance management process for all employees. This helps admins and managers easily track progress and identify where action is needed.
Key Columns in the Pipeline
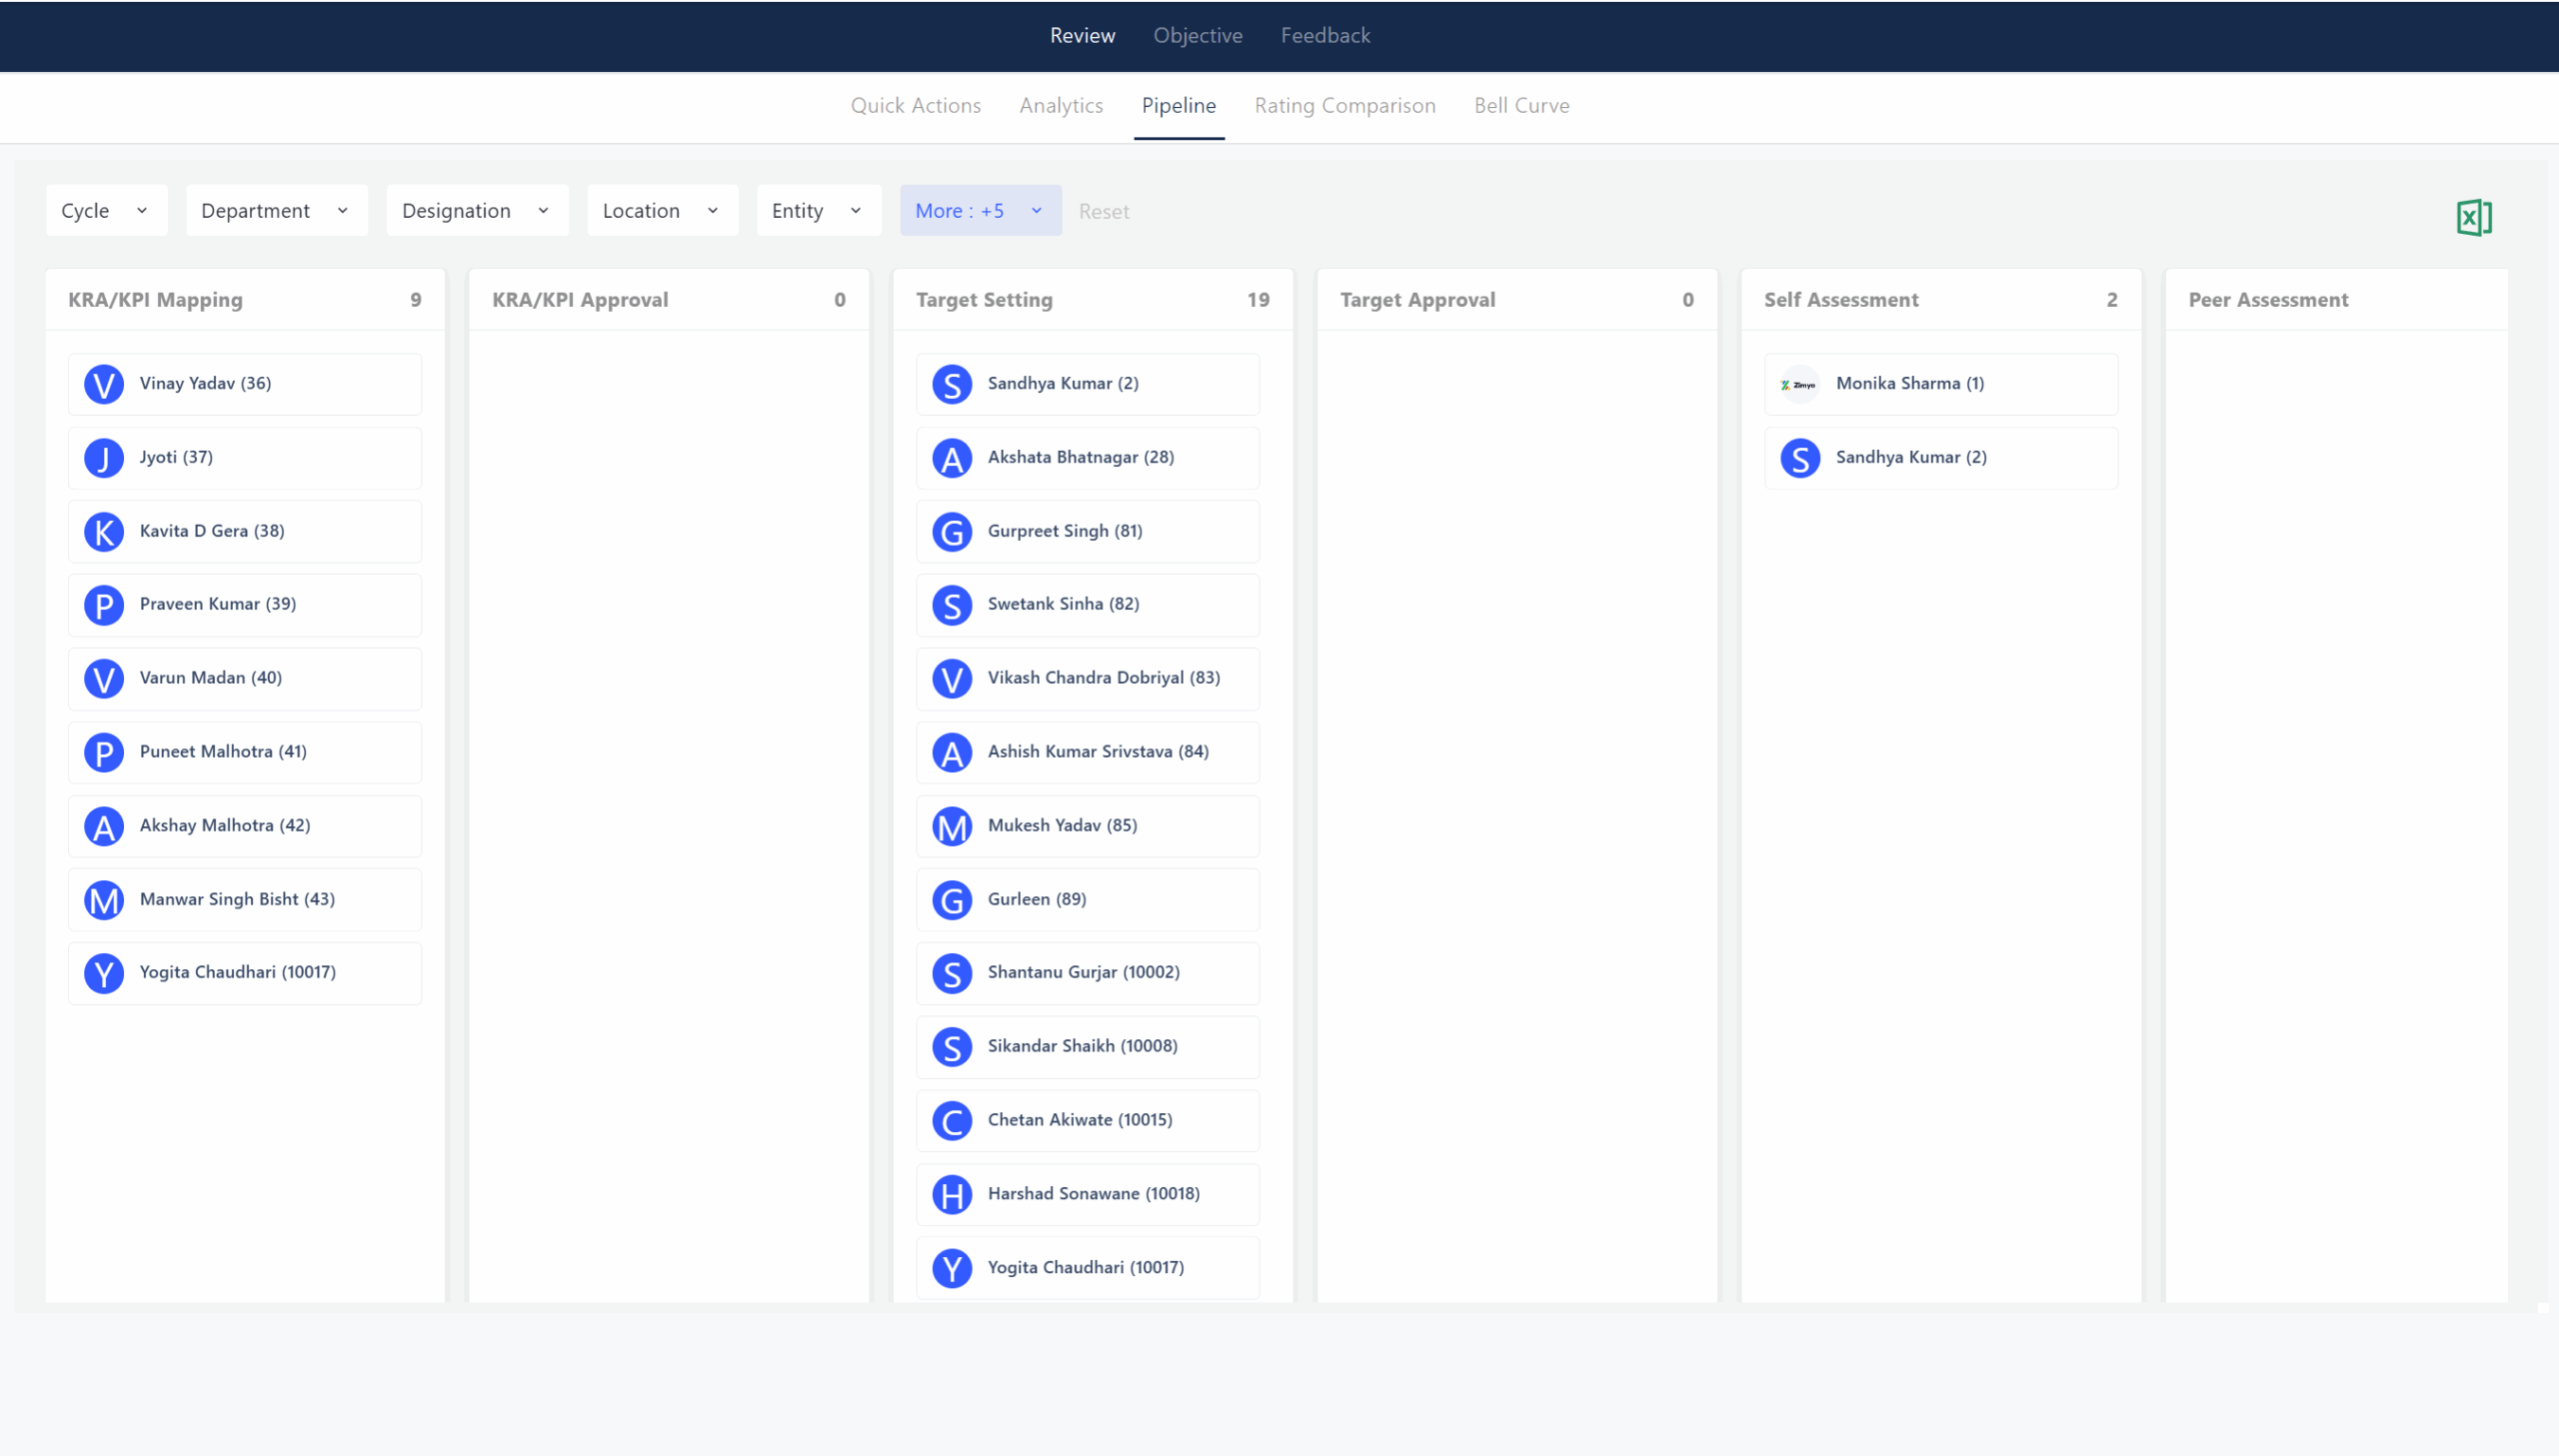
KRA/KPI Mapping
Lists employees who have mapped or defined their Key Result Areas (KRAs) and Key Performance Indicators (KPIs) but may not have submitted them for approval yet. This is the starting point of the performance cycle.
KRA/KPI Approval
Shows employees whose submitted KRAs/KPIs are pending approval by a manager or admin. Quick action here ensures timely progression to the next stage.
Target Setting
Displays employees who need to set their performance targets or goals. These are individuals who have not yet completed this critical step in the process.
Target Approval
Would show employees whose set targets are awaiting managerial approval. In this screenshot, there are currently no pending approvals in this stage.
Self Assessment
Lists employees who need to complete their self-assessment. This is an important part of the review process, allowing employees to reflect on their achievements and challenges.
Peer Assessment
Would display employees whose peer assessments are pending. In this screenshot, there are currently no pending peer assessments.
Rating Comparison
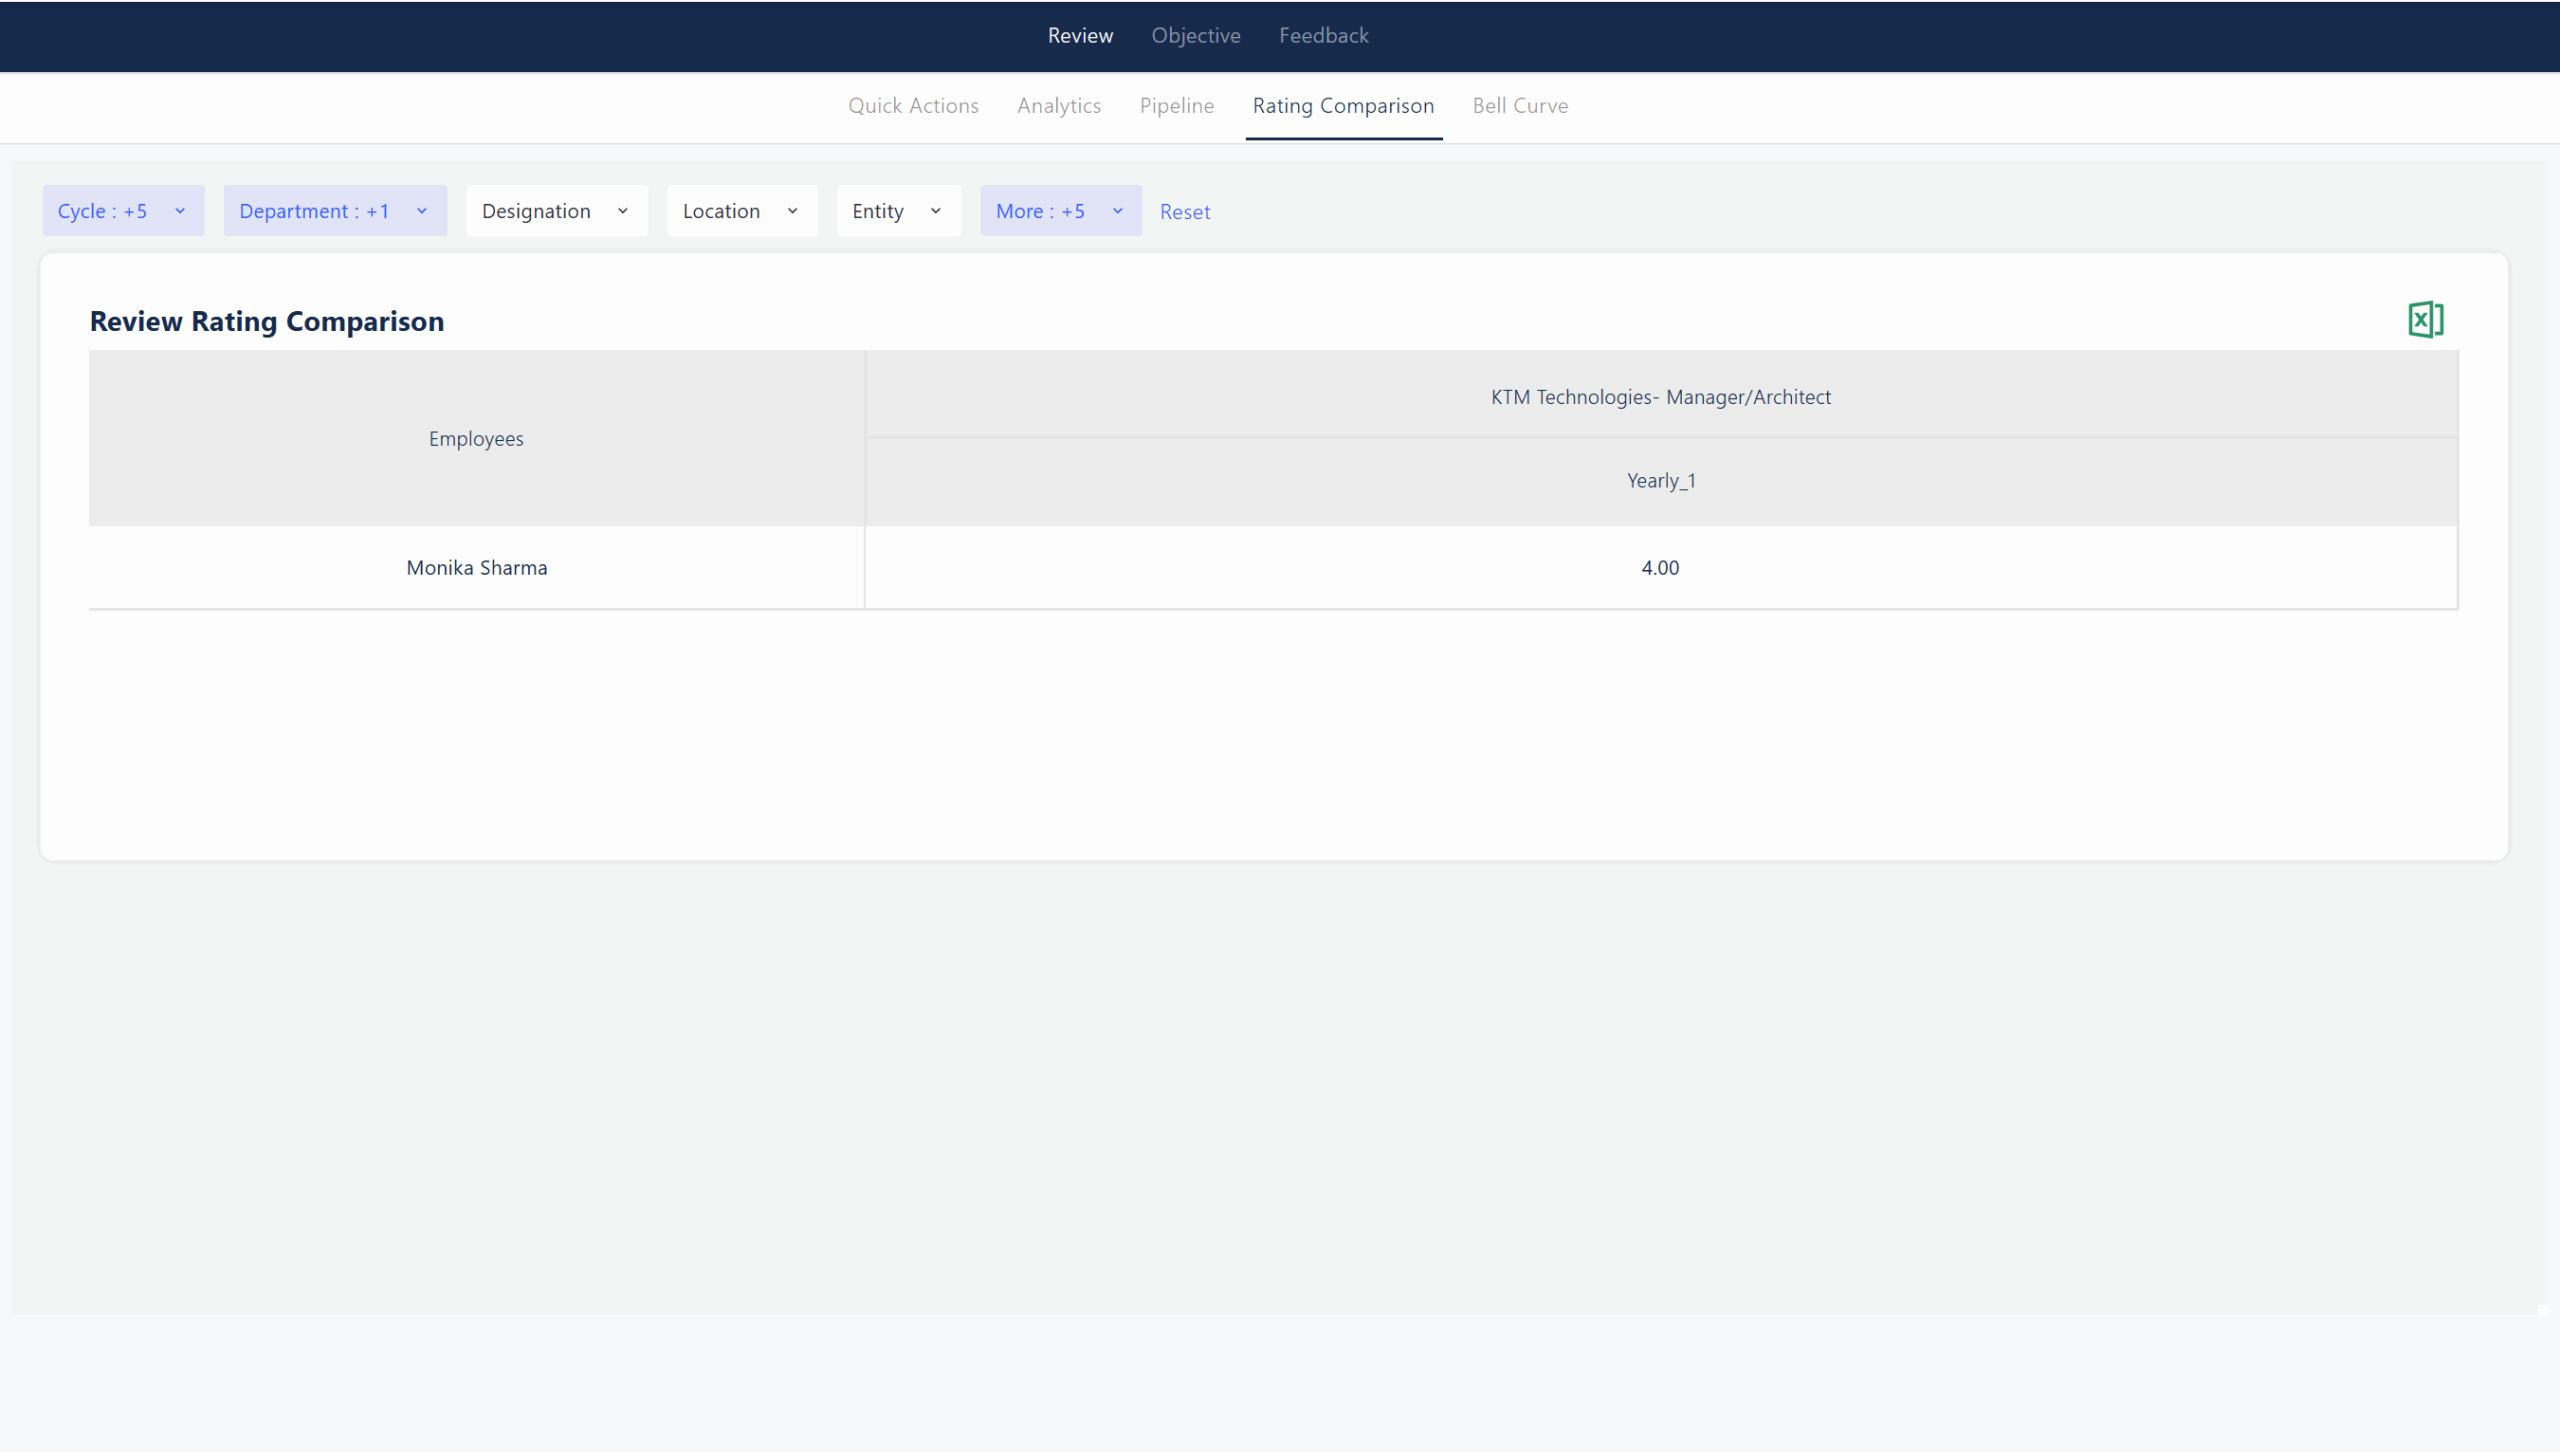
The Review Rating Comparison section in Zimyo Performance allows admins and managers to compare employee performance ratings across different cycles, departments, designations, locations, or entities. This feature is designed to help organizations analyze trends, identify rating patterns, and ensure consistency in performance evaluations.
Bell Curve
The Bell Curve feature in Zimyo Performance provides a visual representation of employee performance ratings across the organization, helping to ensure fair and balanced appraisals.
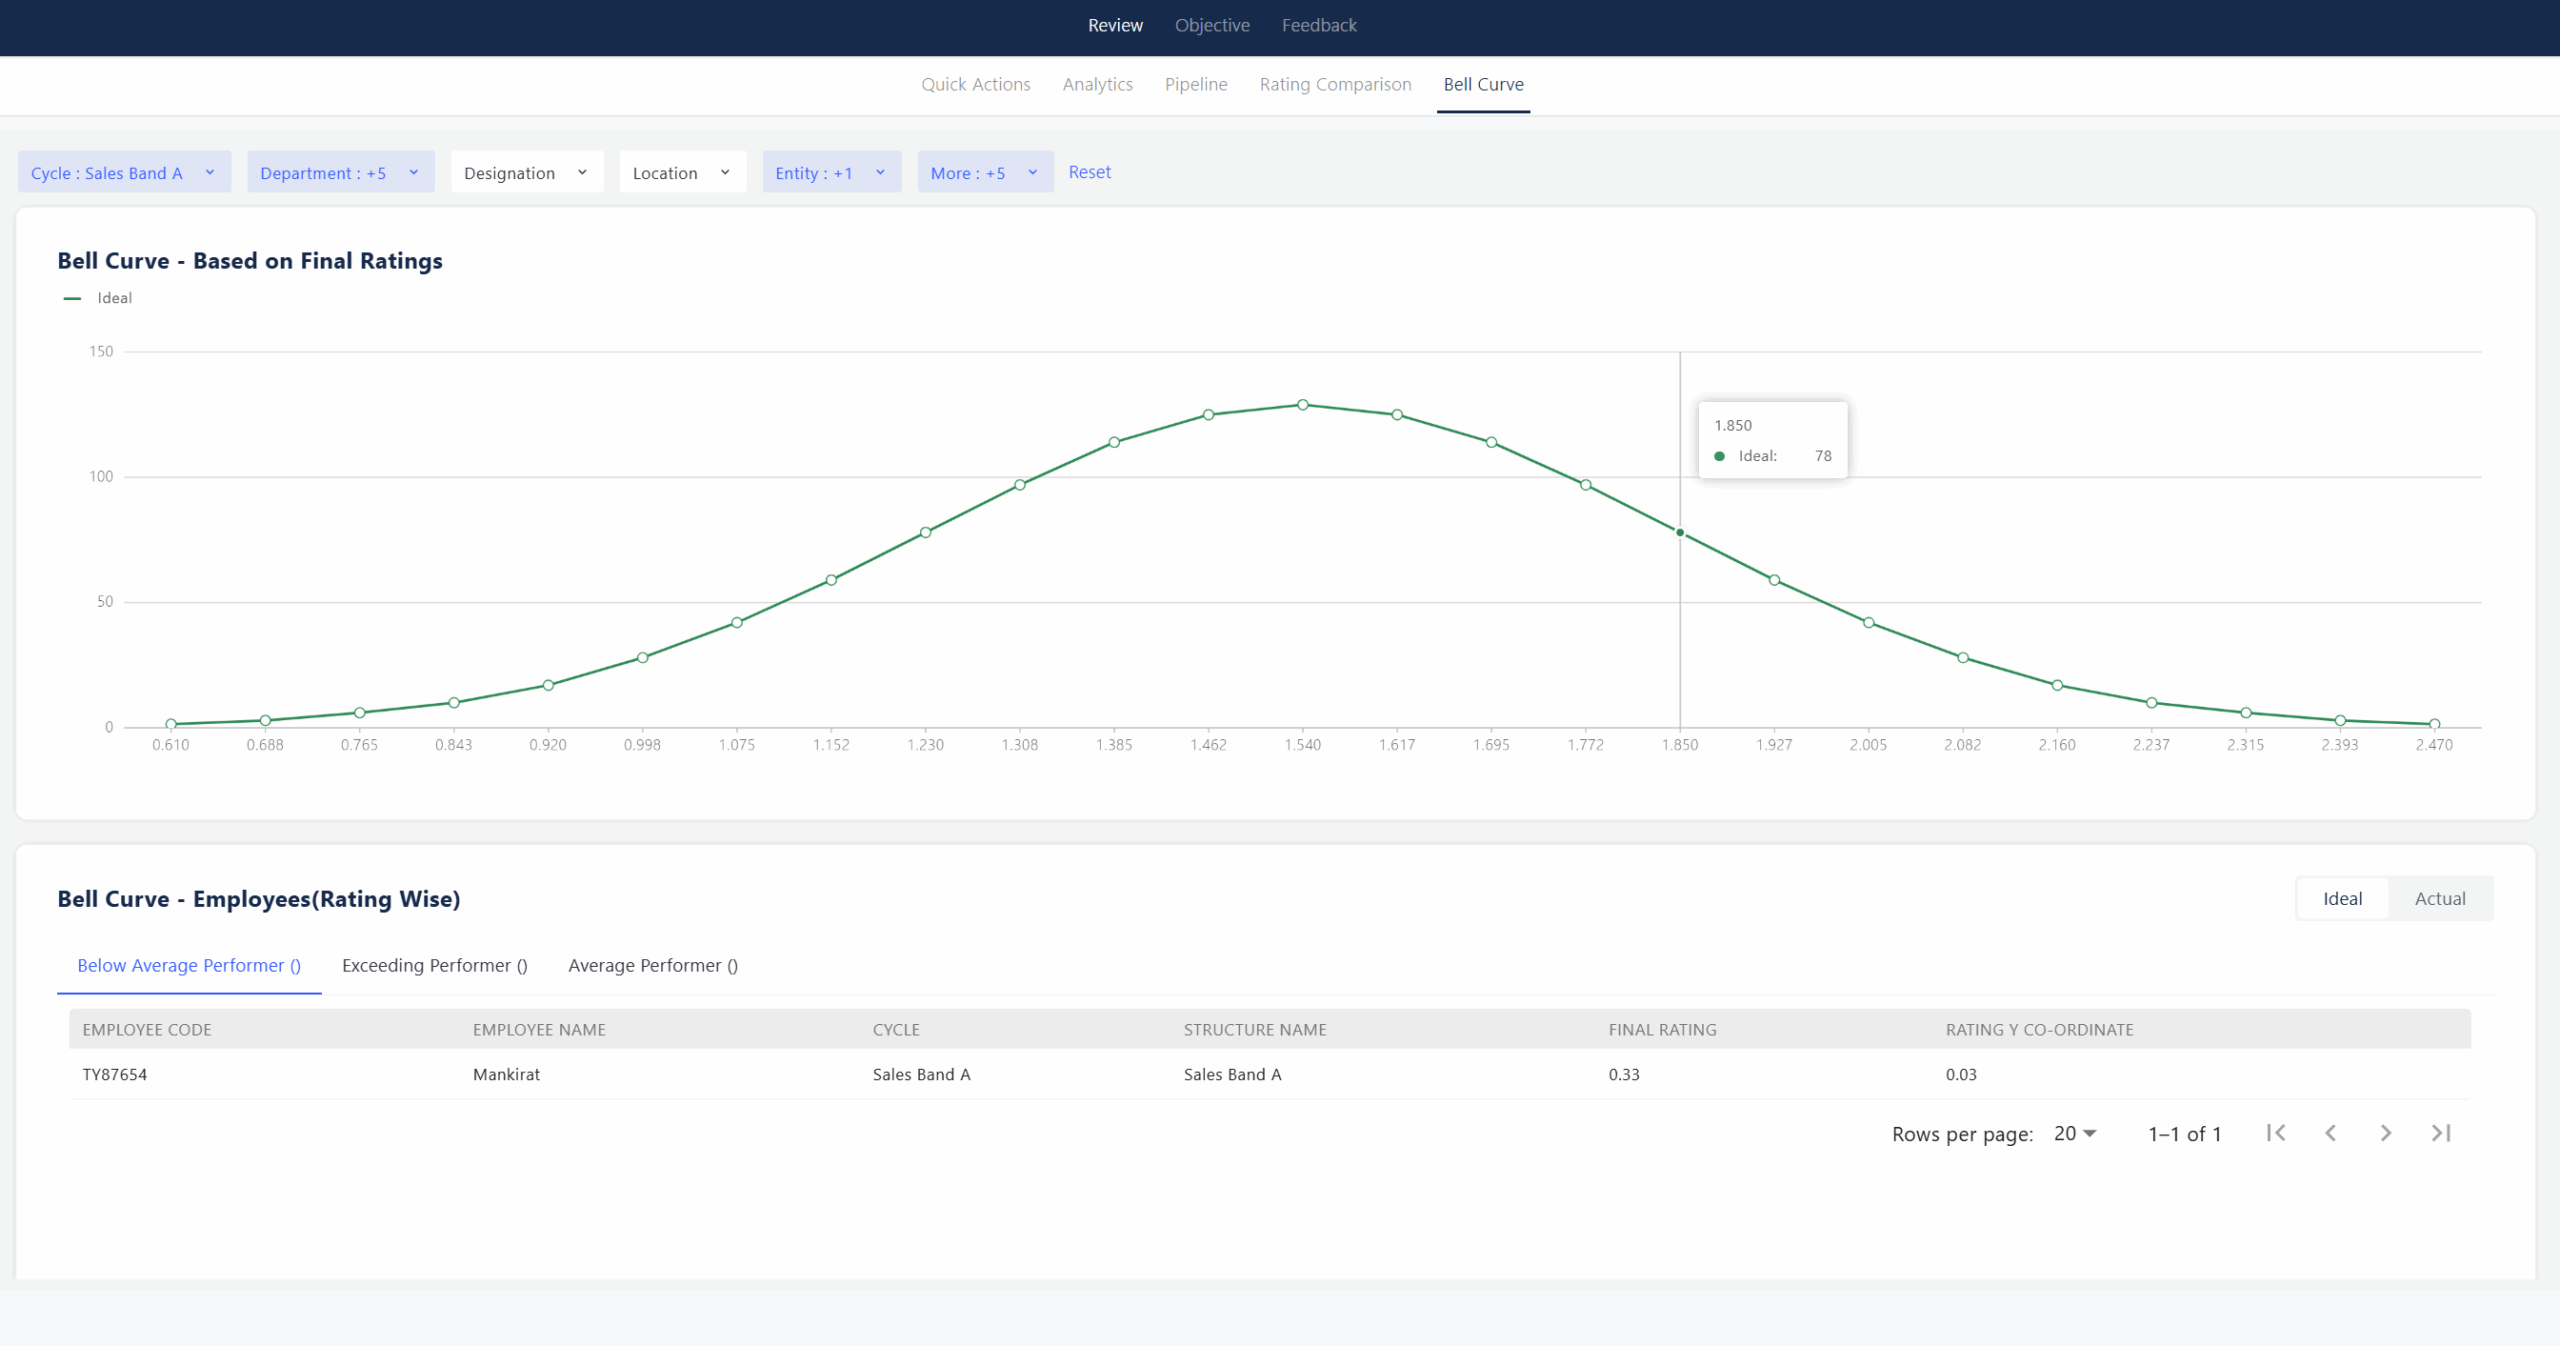
Bell Curve – Based on Final Ratings
This section displays the distribution of employees according to their final performance ratings for a selected review cycle. The bell curve helps HR and managers see if ratings are concentrated in the middle (average performers) or if there are more high or low performers than expected. This aids in identifying rating trends and maintaining consistency across teams.
Bell Curve – Employees (Rating Wise)
Here, employees are grouped based on their performance ratings, allowing comparison between the ideal and actual distribution. This helps organizations check if their ratings align with expected standards, and spot potential rating biases or anomalies.
Objective
Quick Actions
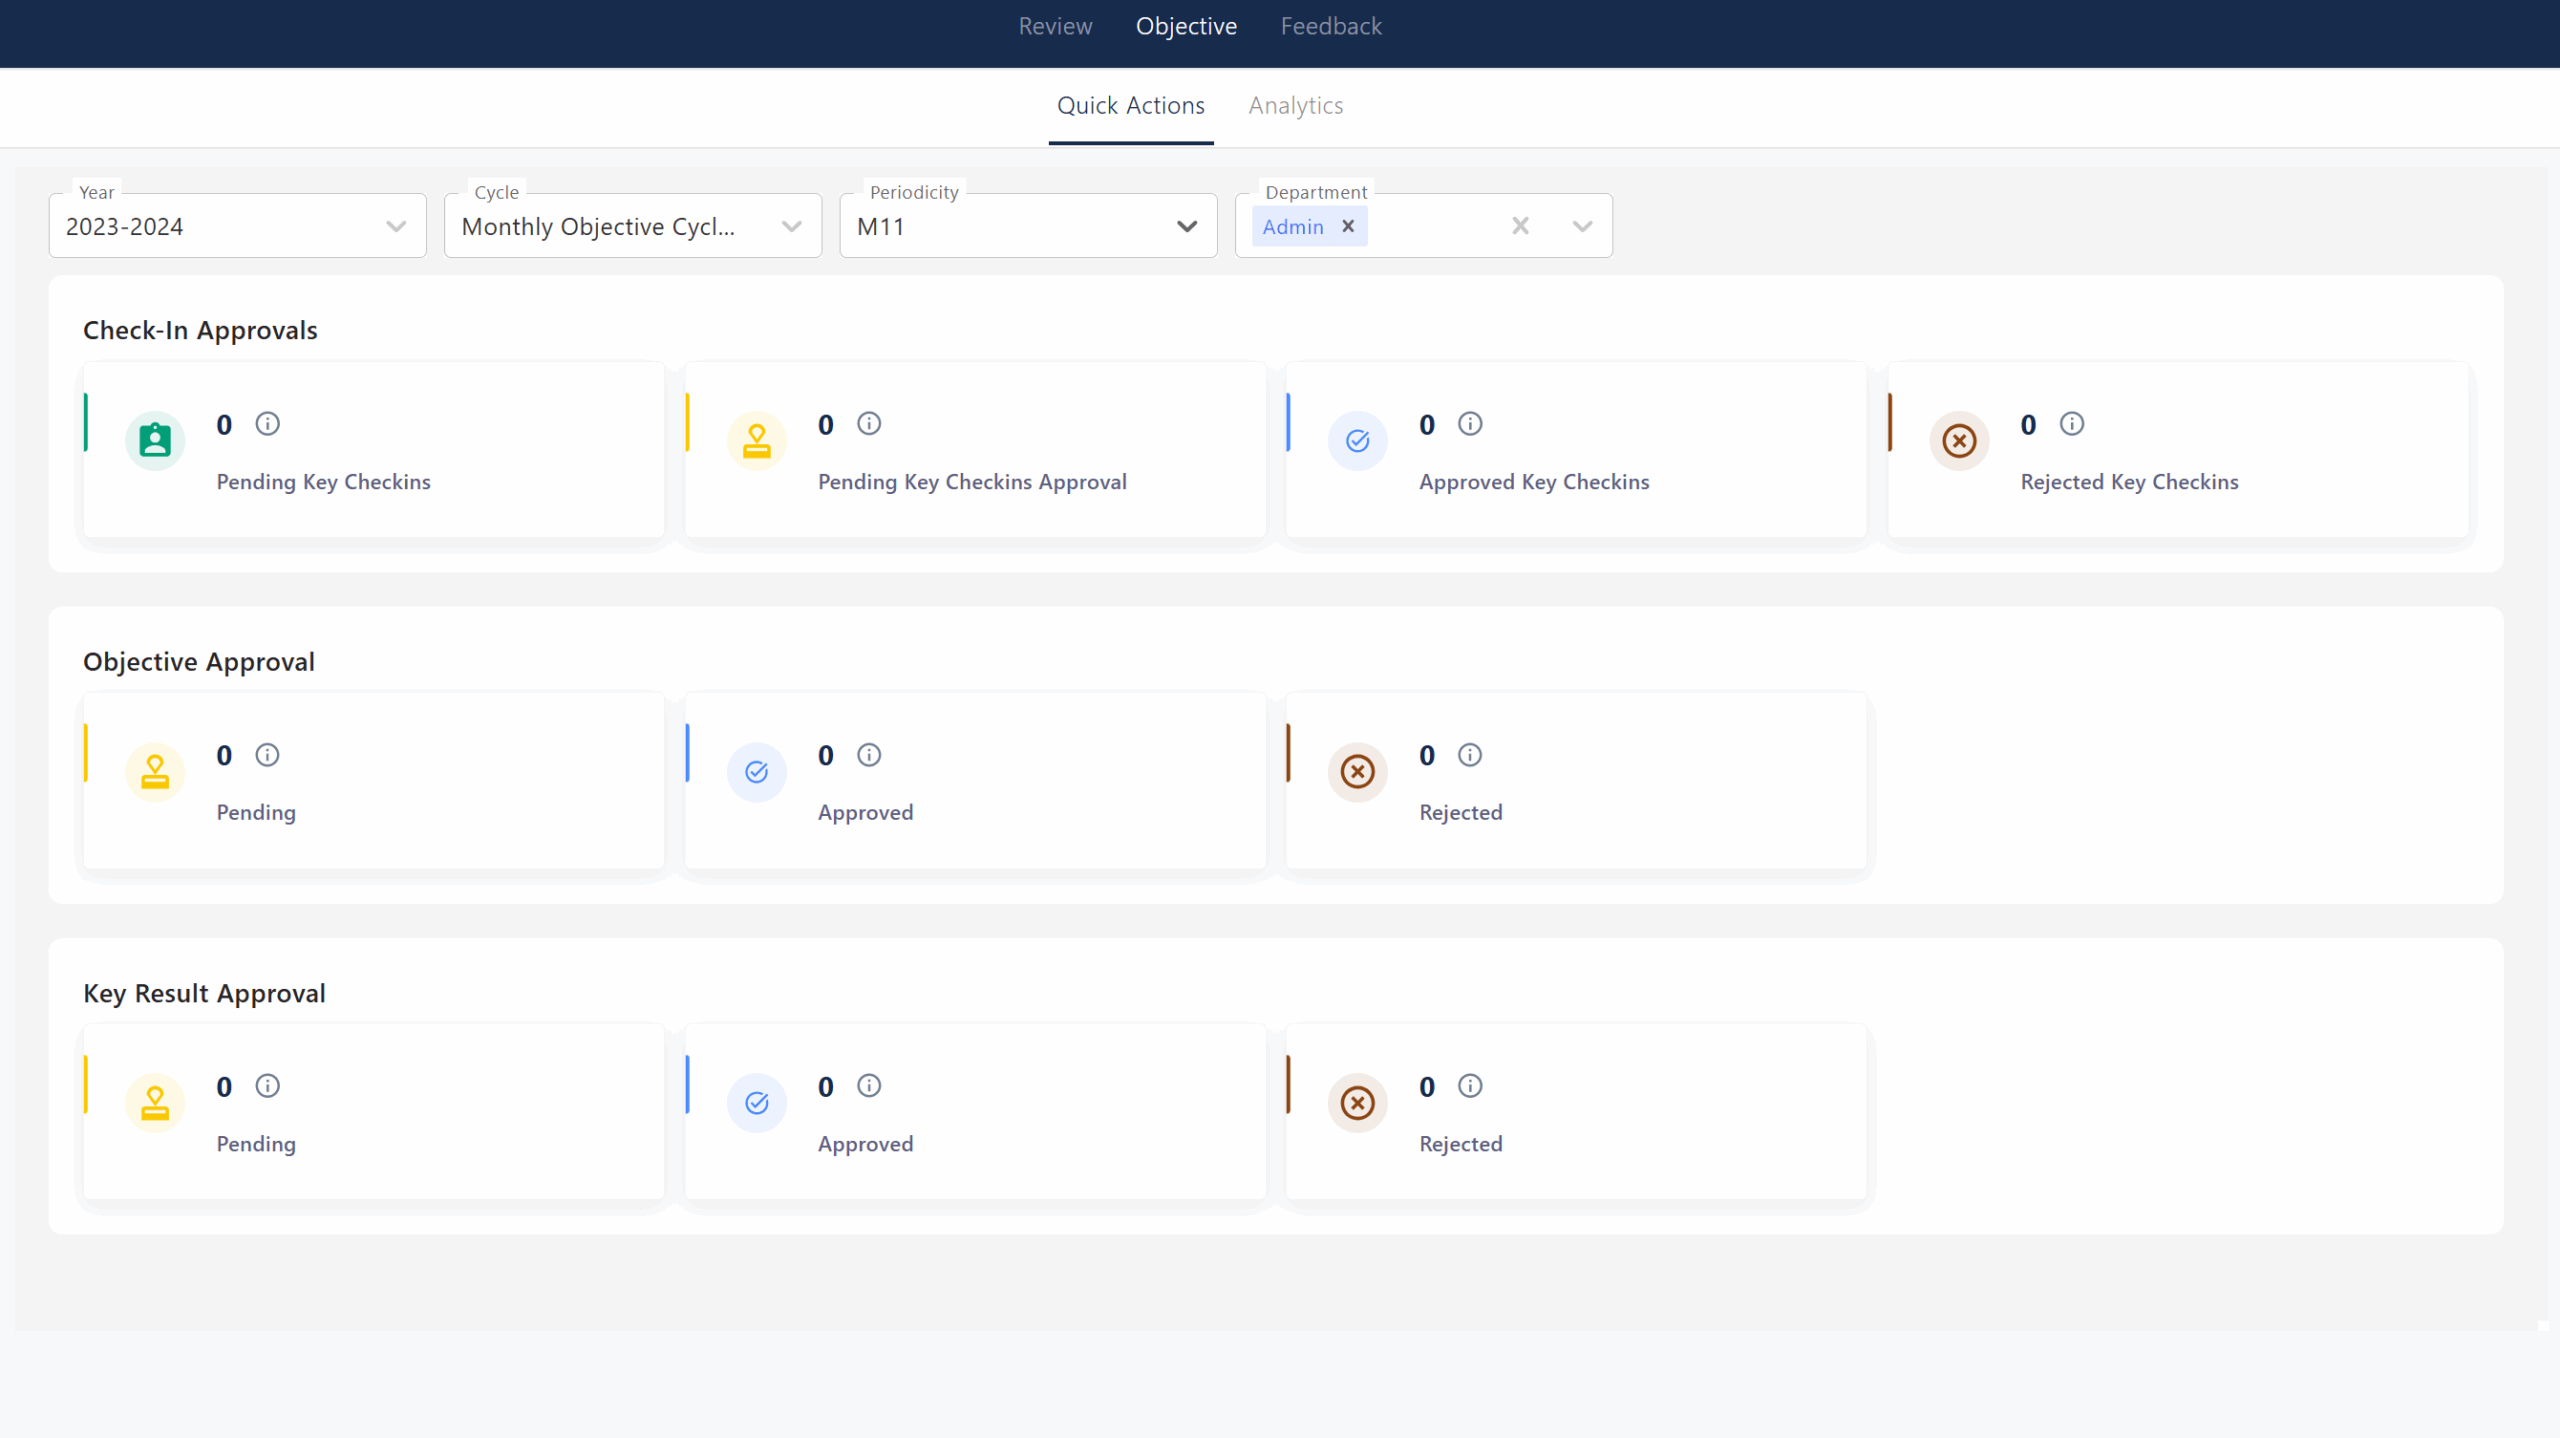
The “Quick Actions” section under the Objectives module provides a consolidated dashboard for managing and tracking approvals related to objectives, key results, and check-ins. It is organized into three main categories:
- Check-In Approvals
- Pending Key Checkins: Displays the number of key check-ins awaiting submission.
- Pending Key Checkins Approval: Shows check-ins that have been submitted and are awaiting approval.
- Approved Key Checkins: Indicates the number of check-ins that have been reviewed and approved.
- Rejected Key Checkins: Lists check-ins that have been reviewed and rejected.
- Objective Approval
- Pending: Objectives that are awaiting approval.
- Approved: Objectives that have been reviewed and approved.
- Rejected: Objectives that have been reviewed and rejected.
- Key Result Approval
- Pending: Key results that are awaiting approval.
- Approved: Key results that have been reviewed and approved.
- Rejected: Key results that have been reviewed and rejected.
Each section provides a real-time count for pending, approved, and rejected items, allowing users and administrators to quickly assess the status of objectives-related activities for the selected cycle, periodicity, and department. This streamlines the approval process and enhances visibility for efficient performance management.
Analytics
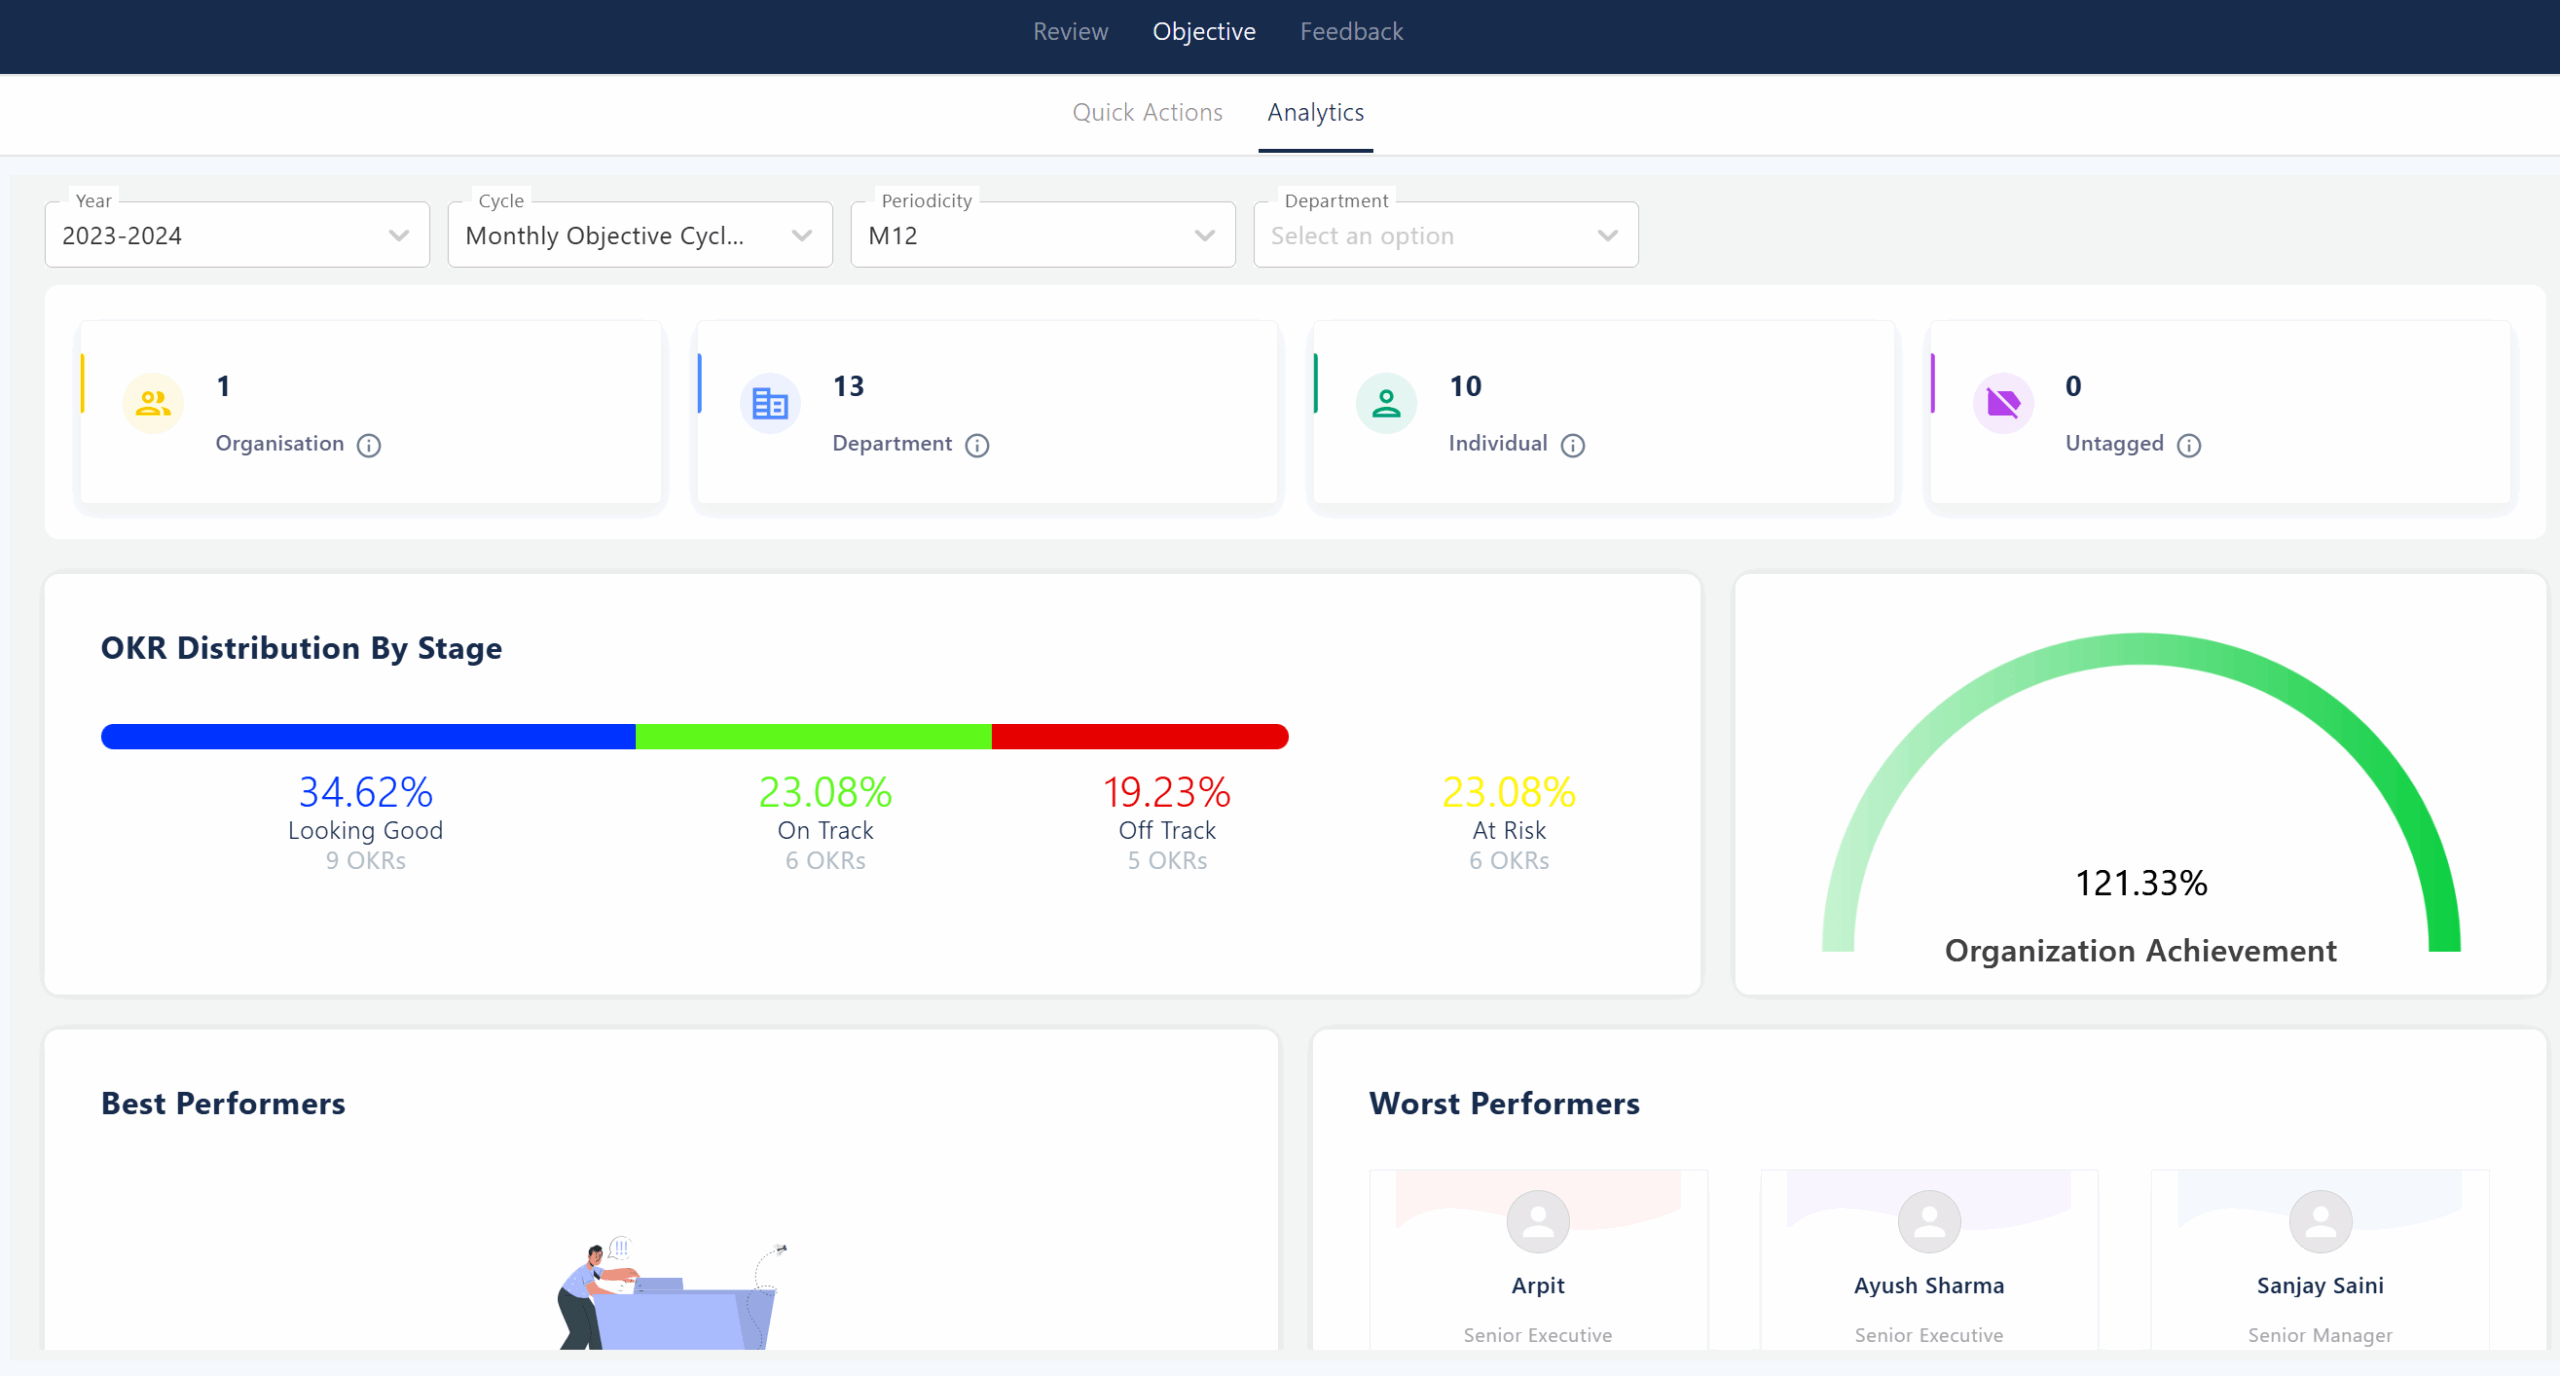
The Analytics section under Objectives provides a comprehensive overview of organizational OKR (Objectives and Key Results) performance through a series of dashboards and visual reports. Key features include:
Summary Metrics
- Displays the total count of OKRs at different organizational levels: Organization, Department, Individual, and Untagged1.
- Users can filter analytics by year, objective cycle, periodicity, and department for focused insights1.
OKR Distribution by Stage
- Visualizes the current status of OKRs across four categories:
- Looking Good (34.62%)
- On Track (23.08%)
- Off Track (19.23%)
- At Risk (23.08%)
- Each category shows both the percentage and the actual number of OKRs, helping stakeholders quickly identify areas needing attention.
Organization Achievement
- Presents the overall achievement percentage for the organization (e.g., 121.33%), indicating progress against set objectives.
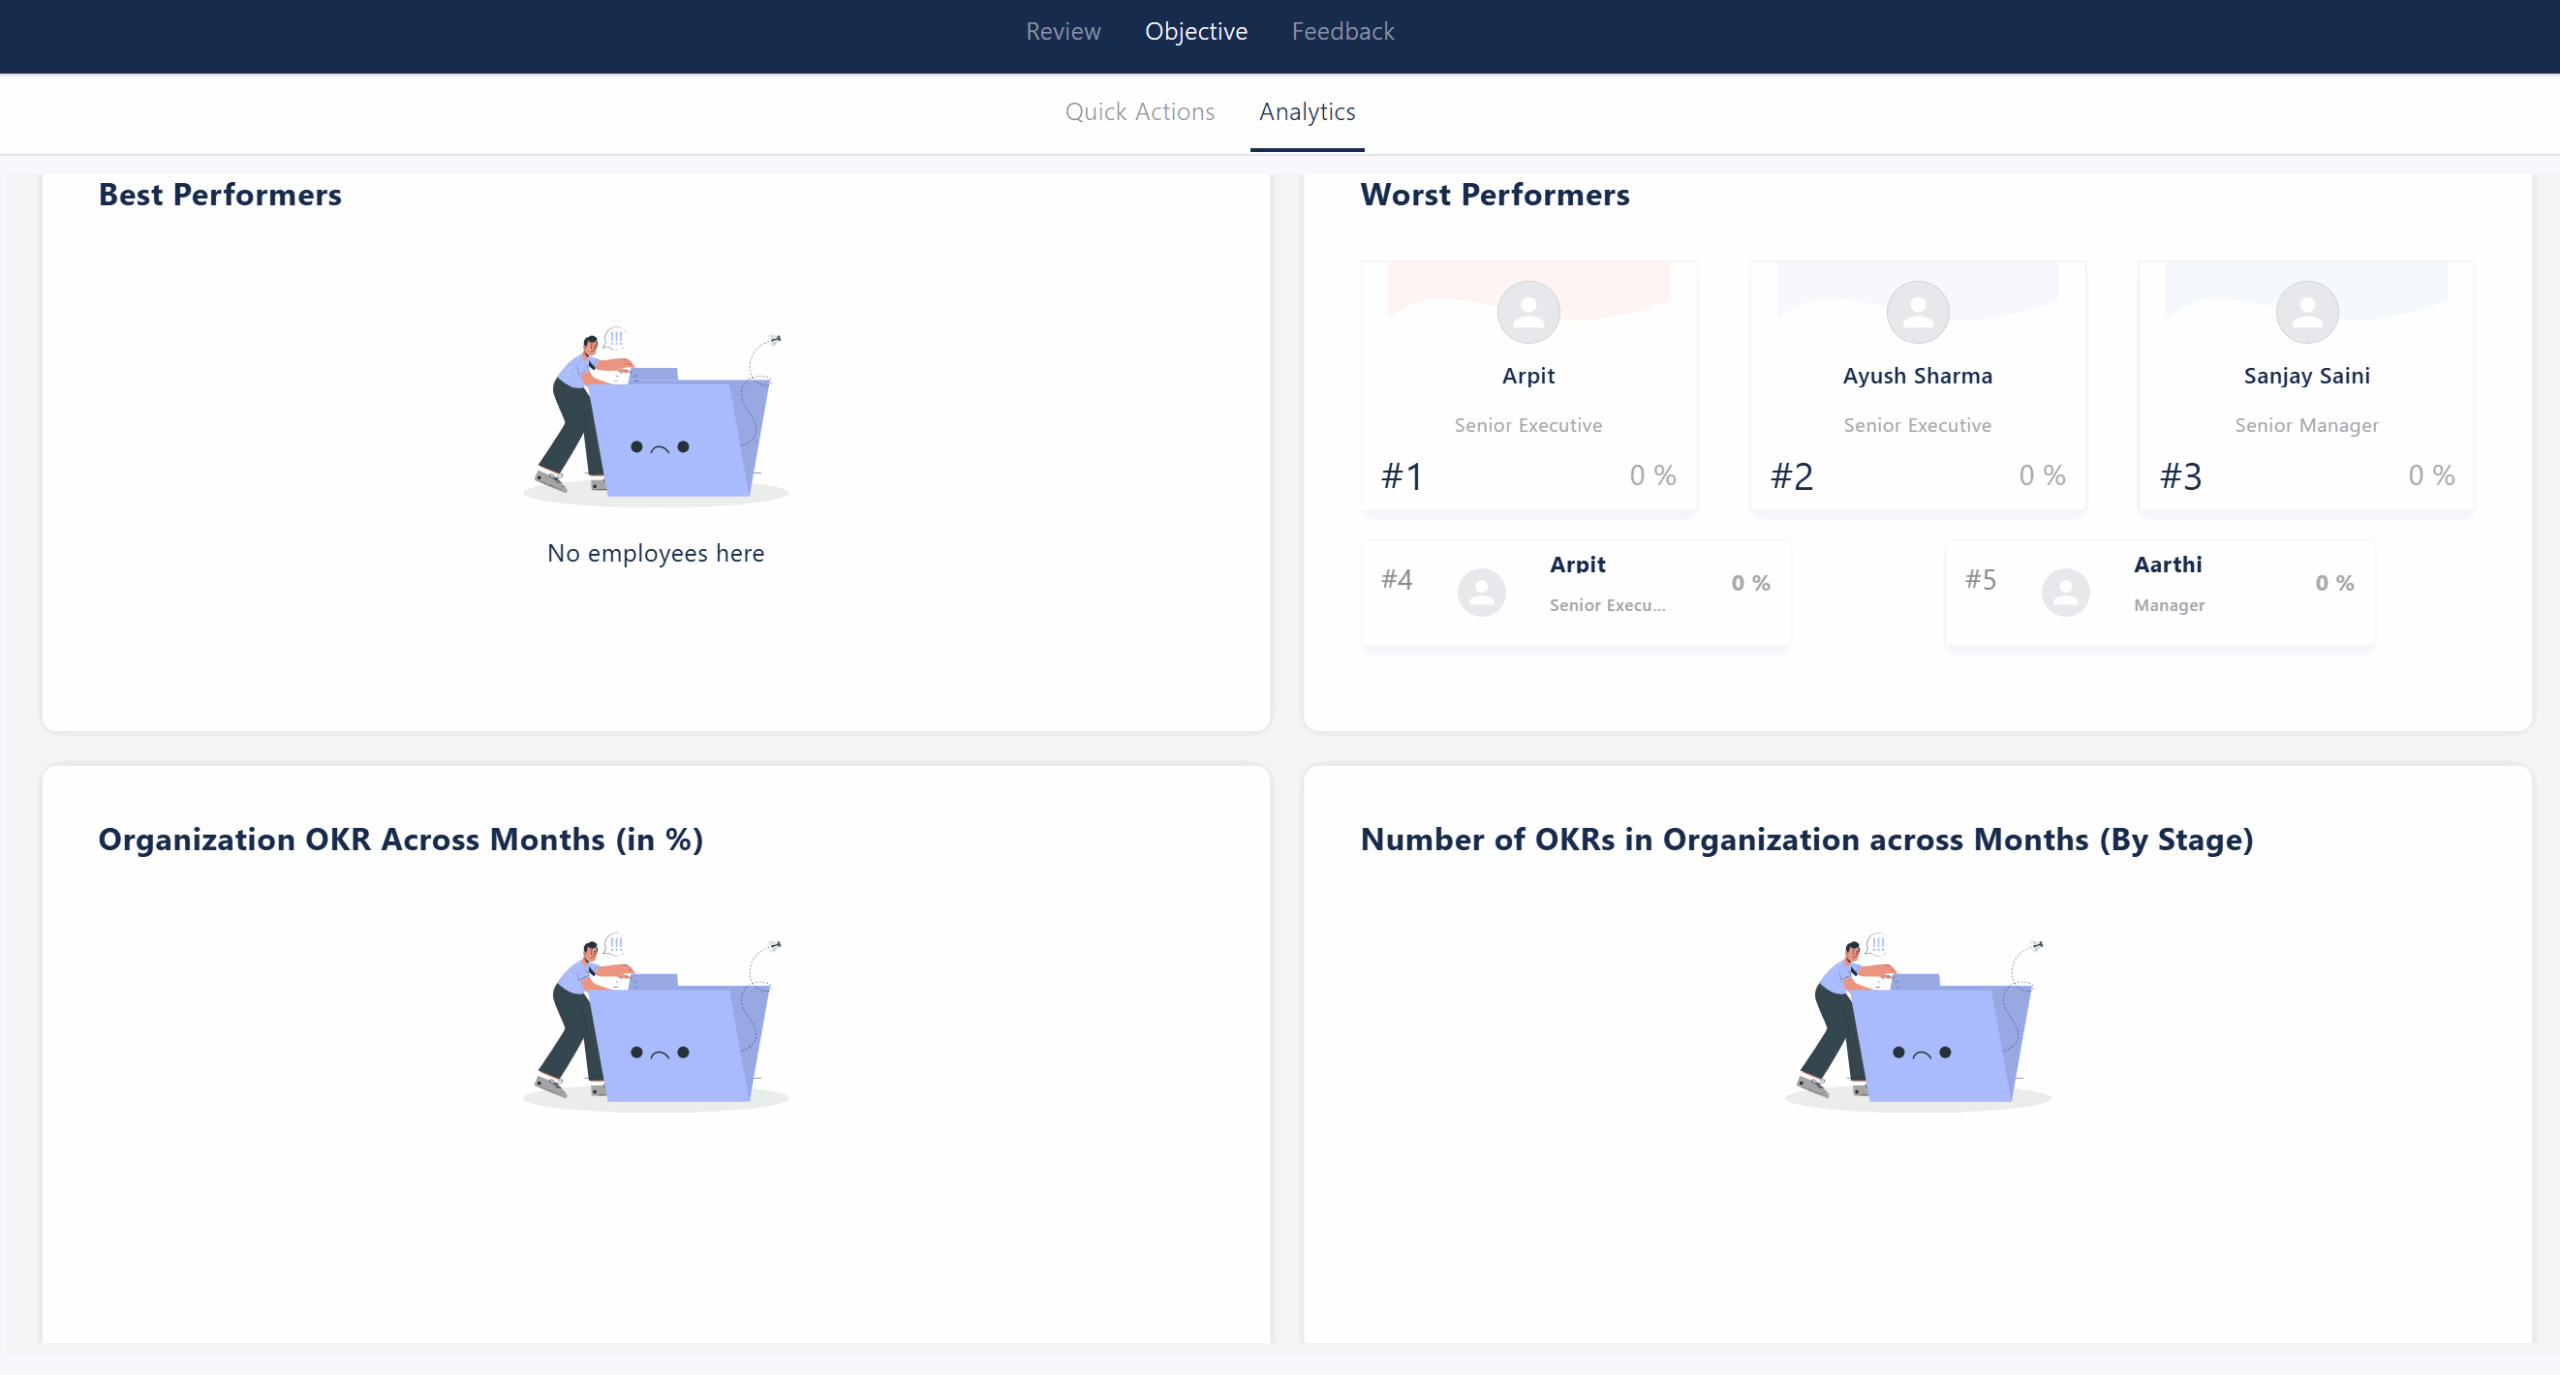
Performance Highlights
- Best Performers: Highlights top employees based on OKR performance (if available).
- Worst Performers: Lists employees with the lowest OKR achievement, ranked by percentage.
Trends and Distribution
- Organization OKR Across Months (in %): Intended to show monthly trends in OKR achievement, though currently no data is displayed in the provided screenshot.
- Number of OKRs in Organization across Months (By Stage): Designed to track how OKR stages change over time, but also shows no data in the current view.
This analytics dashboard gives leadership and managers real-time visibility into OKR progress, organizational alignment, and individual performance, enabling data-driven decision-making and timely interventions.
Feedback
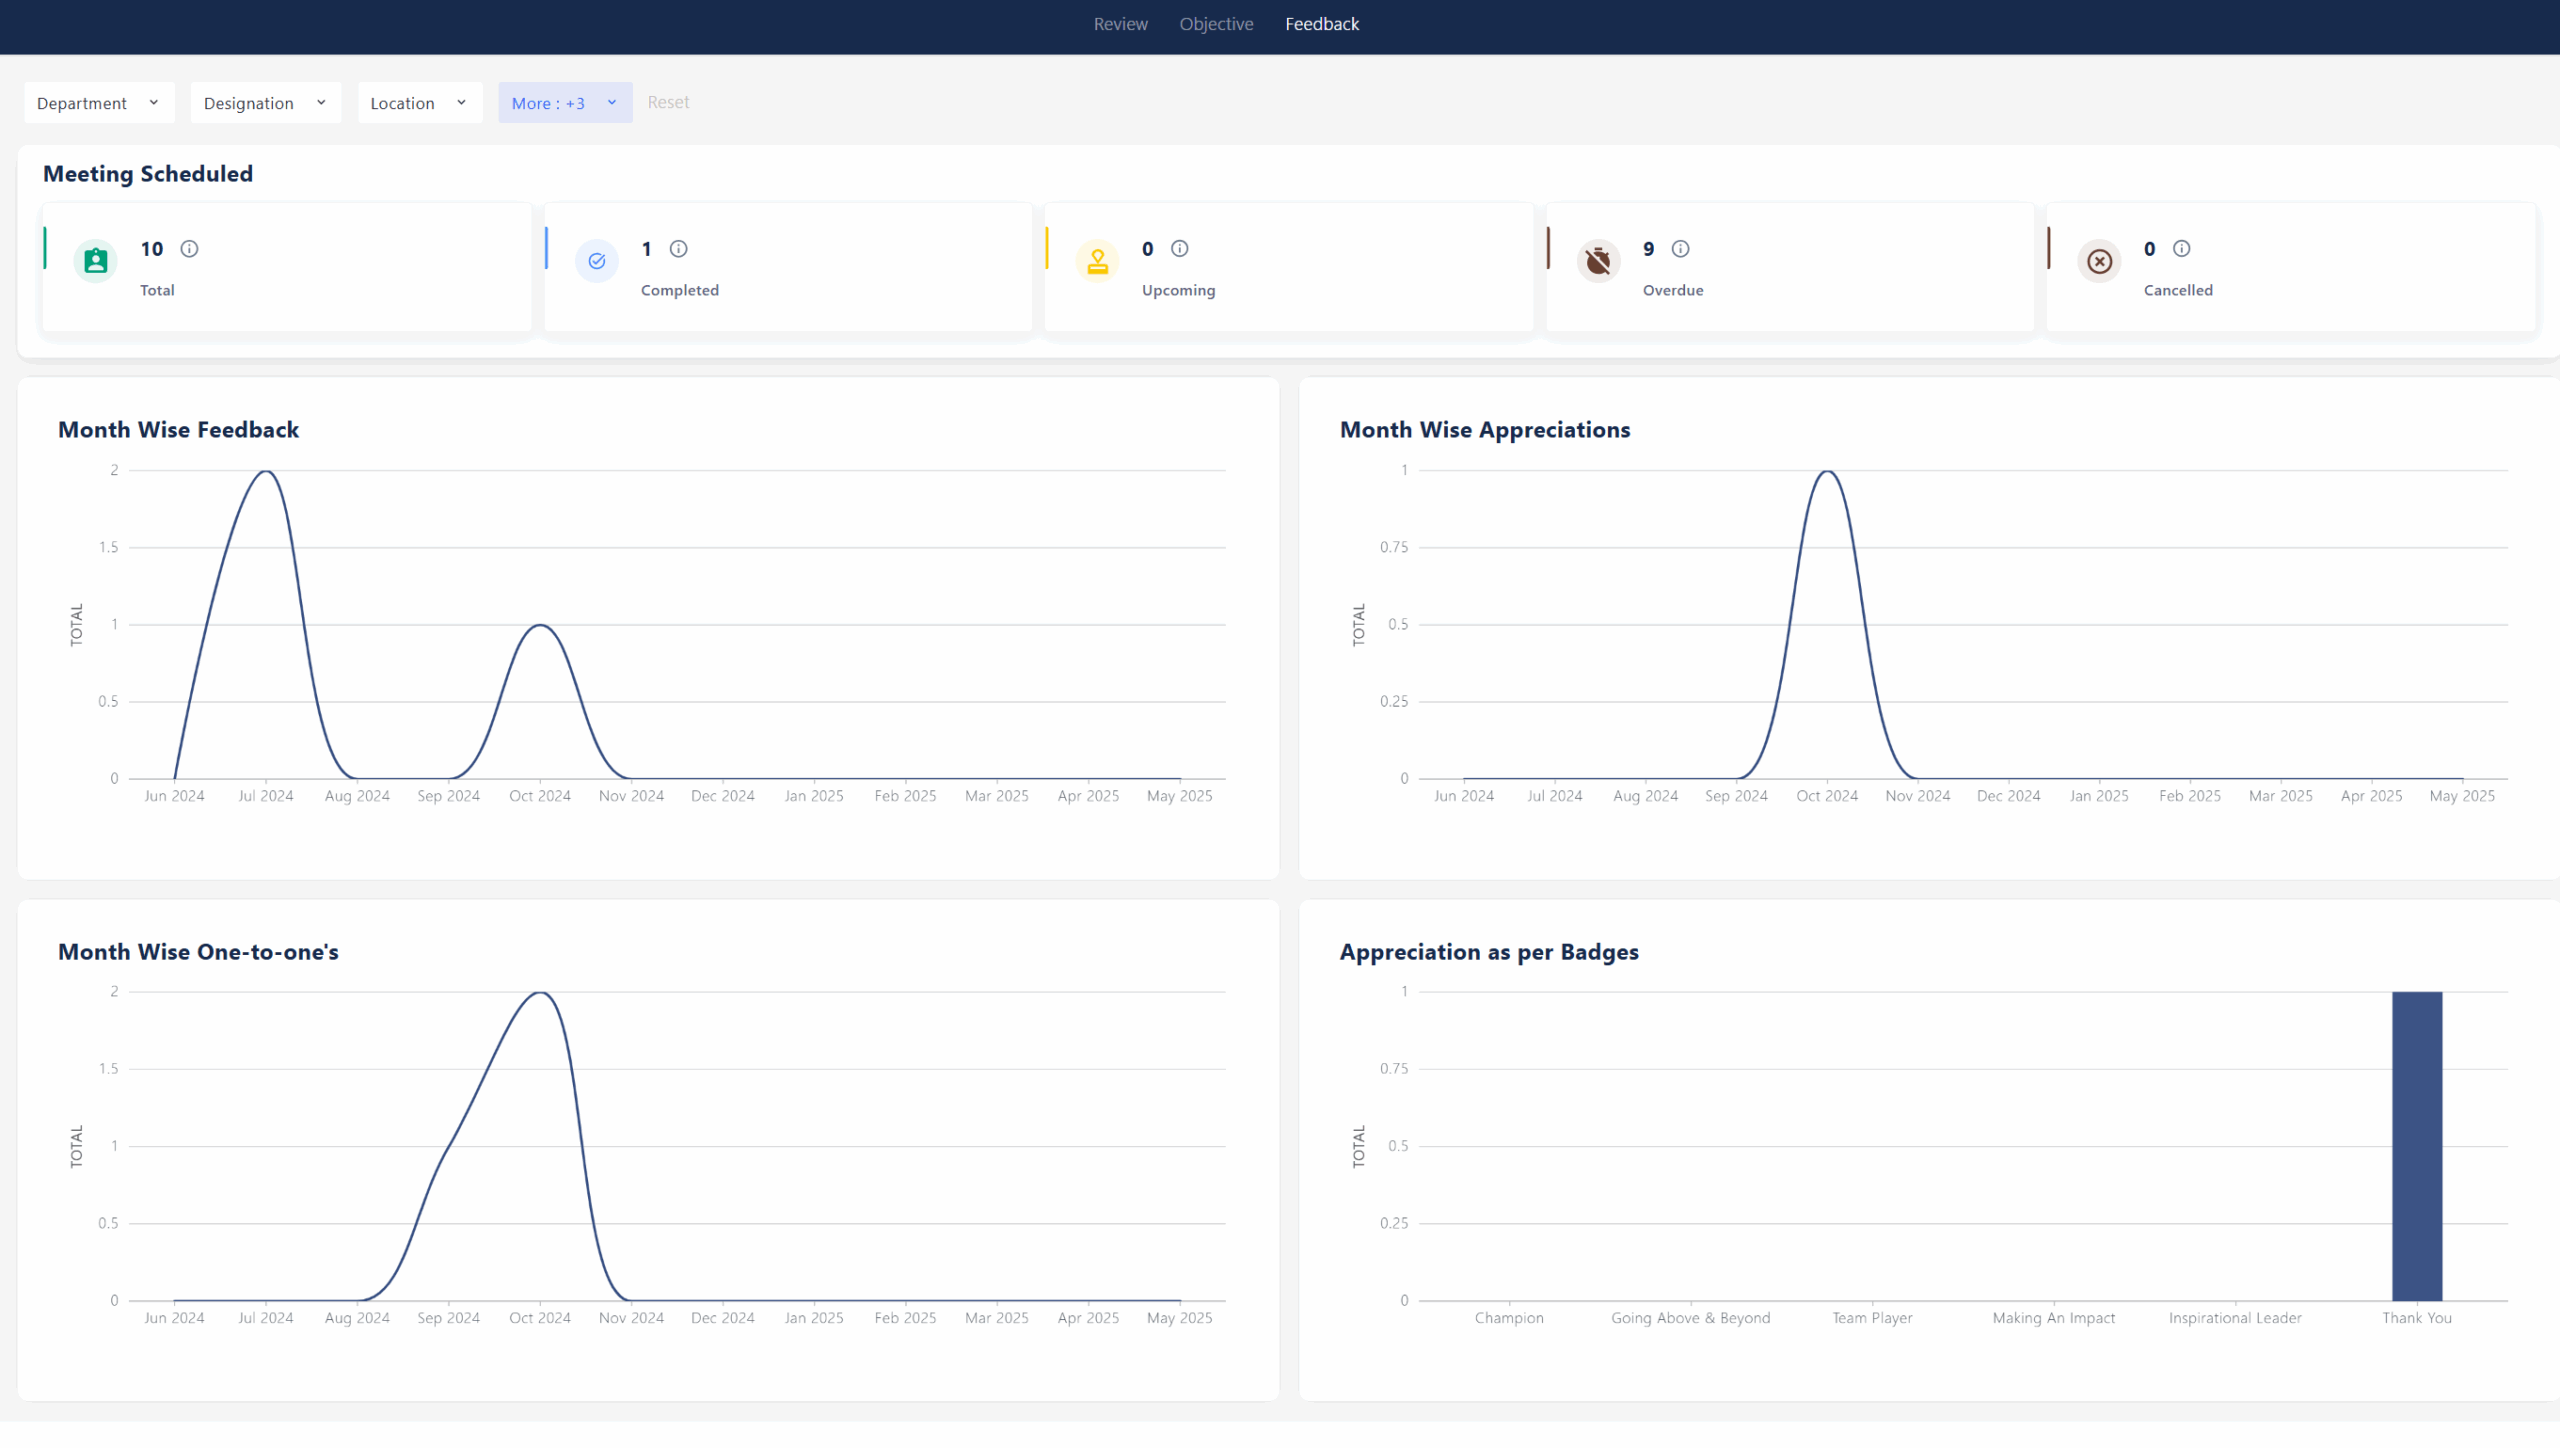
The Feedback dashboard provides a centralized view of all feedback-related activities, meetings, and recognitions within the organization. The dashboard is organized into summary metrics and visual analytics, enabling users to track engagement, feedback trends, and appreciation patterns over time.
Meeting Scheduled
- Displays a summary of all scheduled feedback meetings:
- Total: 10 meetings scheduled
- Completed: 1 meeting
- Upcoming: 0 meetings
- Overdue: 9 meetings
- Cancelled: 0 meetings
Visual Analytics
- Month Wise Feedback:
Shows the distribution of feedback provided each month. Peaks are visible in July 2024 and October 2024, indicating higher feedback activity during these periods. - Month Wise Appreciations:
Tracks the number of appreciations given each month. The data indicates a notable spike in October 2024. - Month Wise One-to-One’s:
Illustrates the frequency of one-on-one meetings held monthly, with a clear peak in October 2024. - Appreciation as per Badges:
Visualizes the distribution of appreciation badges awarded. The “Thank You” badge is the most frequently given, while other badges such as “Champion,” “Going Above & Beyond,” “Team Player,” “Making An Impact,” and “Inspirational Leader” have not been awarded in the current data set.
This dashboard enables organizations to monitor feedback cycles, identify periods of high or low engagement, and recognize employees’ contributions, supporting a culture of continuous feedback and appreciation.